6717
6717
We are actively making updates and improvements, and functionality or data may change as we continue development.
BenchPrep Analytics delivers faster, more customizable insights that help key stakeholders track learner progress, measure performance, and act with confidence.
By surfacing analytics at all levels—from individual learners to groups, courses, and branches—our dashboards give administrators, program managers, and instructors stronger visibility to make data-driven decisions that improve learning outcomes.
The analytics experience is organized into several key sections, each designed to present data at a different level of granularity.
When reviewing Analytics Data keep in mind:
- Access to analytics requires the Read Reports permission. You can only view data for programs and courses within your assigned scope.
- All analytics data is displayed in the Console User's time zone. For example if the console user is located in the Central Time zone all data displayed will be in Central Time.
- The data is refreshed on an hourly basis.
- Analytics includes only users without administrative or custom roles. Users with these roles are excluded from reporting.
- Analytics only displays the data of active learners. Learners that are inactive or have expired enrollments are not included in the analytics data.
Analytics data is available across multiple areas in Console. The sections below outline where key data points can be found.
Within the Manage Users section in Console:
- The Course Overview section of the User Detail page shows progress and performance data at the user level for any learners you have permission to view. The dashboard includes metrics such as total enrollments, average test scores, course progress, and more.
- The Branch Dashboard Overview section of the Branch Detail page displays branch level data for customers who utilize our Enterprise Engine offering. The dashboard offers a comprehensive overview of progress and performance data specific to groups and learners within the selected branch. Branch Dashboard only displays data of active learners.
- The Group Overview section of the Group Detail page gives an overview of enrollment and performance data scoped to the selected group. The section offers a comprehensive overview of progress and performance data specific to the group in your access context. Group Dashboard only displays data of active learners.
Under the Analytics section in Console:
- The Course Report dashboard gives a comprehensive view of course activity and performance. It provides detailed insights into exams, quizzes, and all learning modalities, along with learner engagement and outcomes.
- The Sessions Detail Report dashboard houses the Session Report Table. When the Sessions Report Table is enable it displays every time a learner accesses the platform, which course they open, and for how long the learner was in the course.
Viewing User Insights
Users with a custom role with the “Read Users” and "Read Reports'' permissions will have access to the User Detail page and the Course Overview section, scoped to the level the role is assigned at. Users with a Console Admin role will see all users in the tenant.
If you’re a Group Manager, Instructor, or have a custom role with group-level permissions, you’ll see learner data only for the group scope you have selected. To view learners in another group, simply switch your access context. To learn how to switch context between roles please click here.
To view data for learners under your purview, follow these steps:
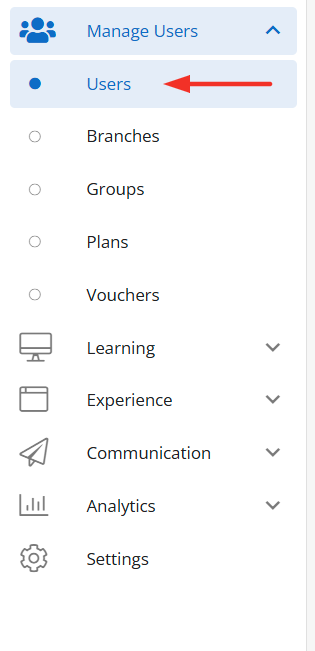
Open Console and select Users under Manage Users, then select the learner you want to view.
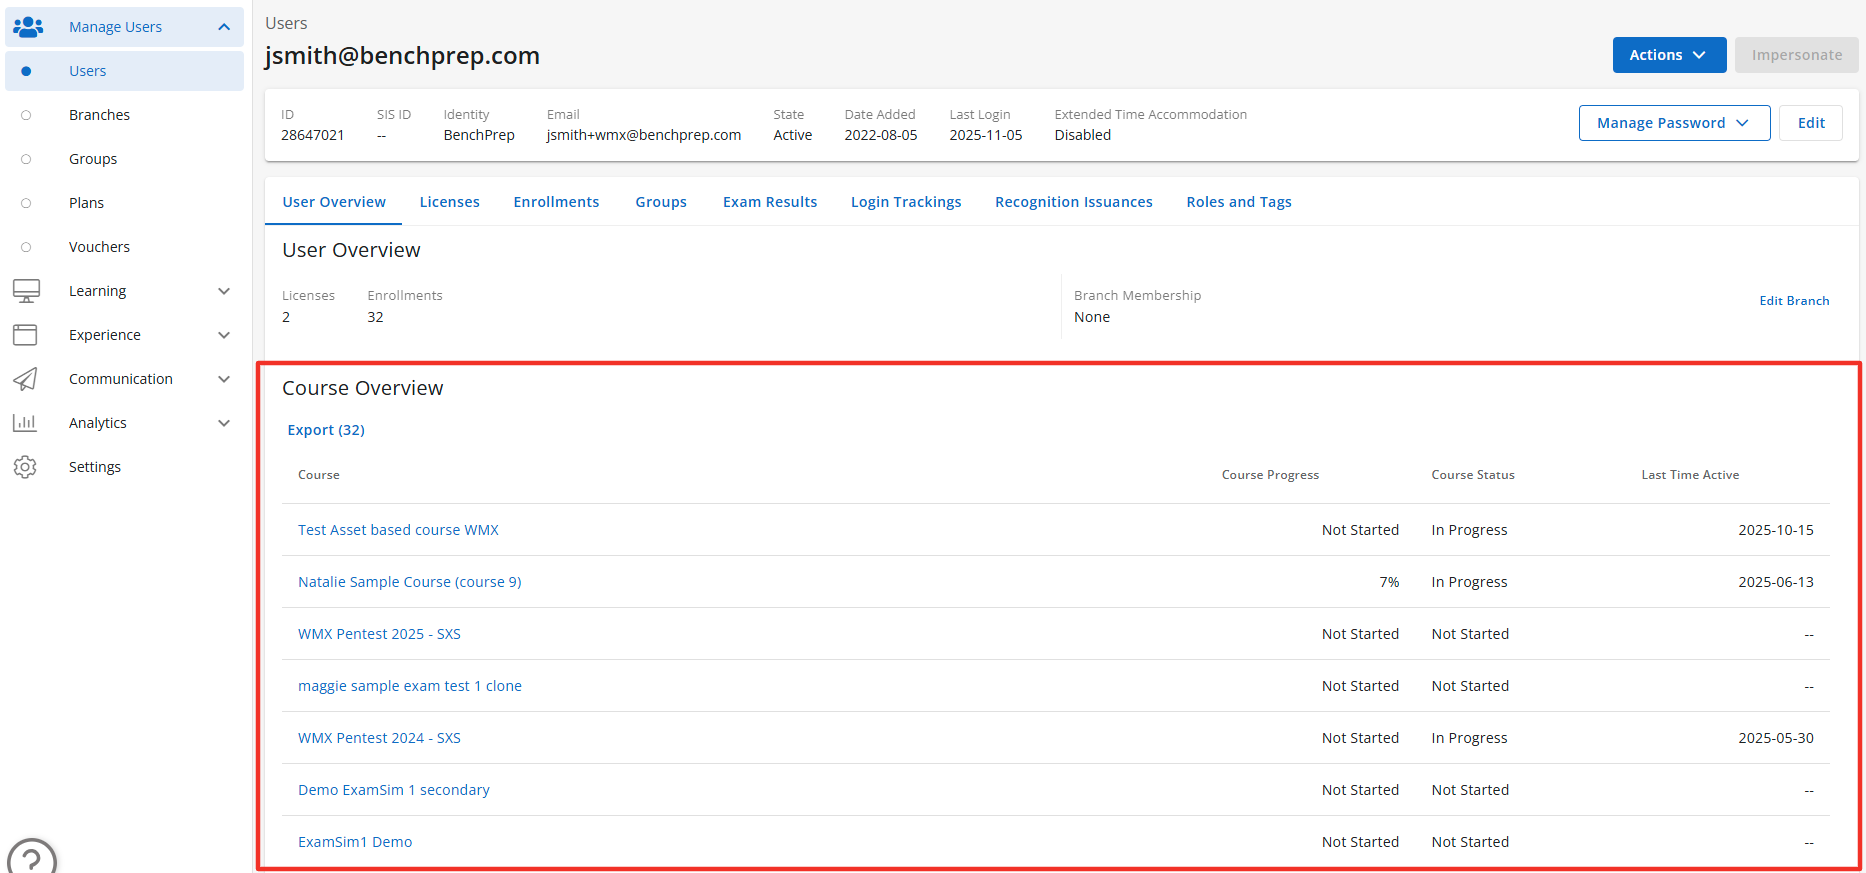
Once selected the User’s Detail page will display an overview of the learner's licenses and the number of their enrollments, Exam Results and other data. To view additional details about the User Detail page click here.

When enabled the Course Overview section displays the following fields when the Course Table is enabled:
- Course Name - Name of the course.
- Course Progress - This data point displays course progress for each learner’s enrollment. Course progress is determined by the Study Plan progress within the course. If a Study Plan is not used it is determined by the number of content items completed with the course divided by available content items.
- Course Status - Not Started, In Progress, Completed, Expired.
- Last Time Active - Displays the last time a learner completed an activity in the selected course. An activity consists of taking action (i.e. completing, creating, editing, or deleting) for one of the following:
- Confidence levels (lessons, flashcards, or questions)
- Practice questions
- Exams
- Essays
- Bookmarks
- Highlights
- Notes
- Resets (practice questions or exams)
- Continuous learning cycle (if applicable
The Course Overview Table is a sub-feature of the Course Overview Tab, to learn more about how to manage this feature please click here.
You also have the ability to Export all data from this table. Simply click on the Export button above the Name column and the CSV will be sent to you via email.
To view more data about a learner’s specific course click on any course.
Once you select a course you will be presented with additional course level information.
Study Plan Analytics
The Study Plan tab is a sub-feature of the User Details feature to learn more about how to manage this feature please click here. The Study Plan tab when enabled displays Study Plan Table when enabled. The following fields are displayed when the Study Plan Table is enabled:
- Name - Name of the Study Tasks and Study Task Groups.
- Progress - Progress the learner has made on a specific Study Task or Study Task Group.
- Learnable Type - The type of learnable the Study Task is like Lesson, Practice, and Test for example.
- Last Attempt - The date the last task was completed.
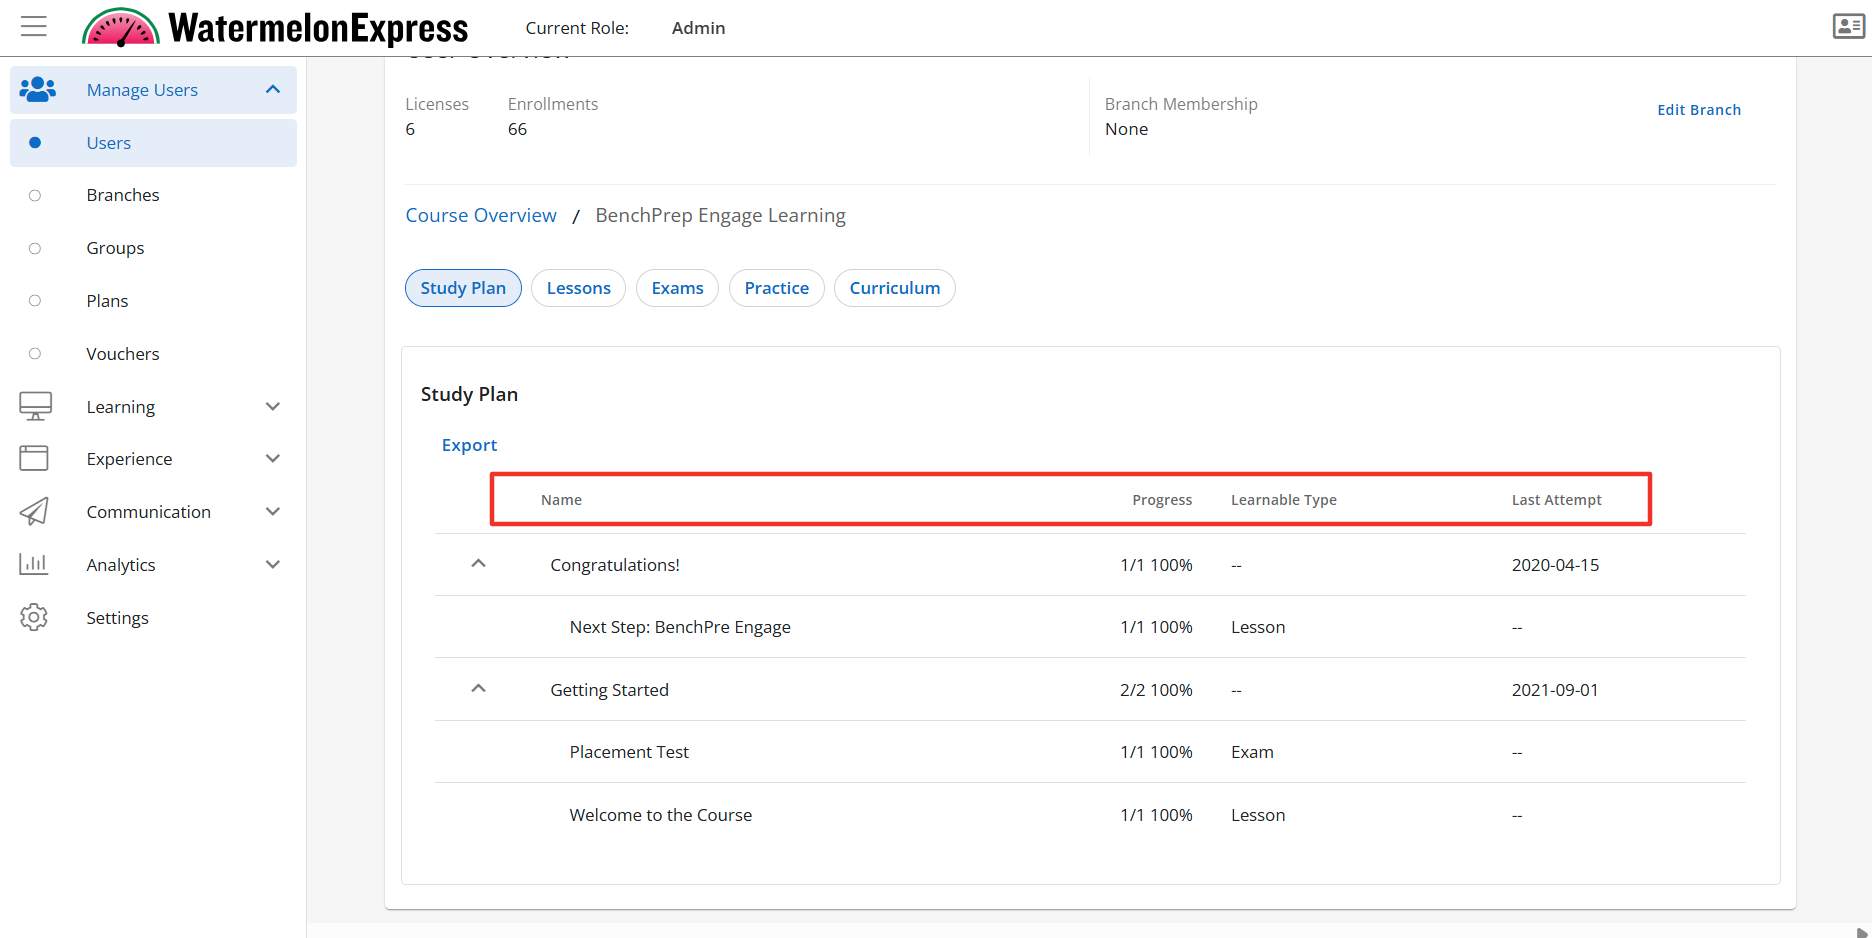
You also have the ability to Export all data from this table. Simply click on the Export button above the Name column and the CSV will be sent to you via email.
The Study Plan Table is a sub-feature of the Study Plan Tab, to learn more about how to manage this feature please click here.
Lesson Analytics
The Lessons tab when enabled displays the following fields when the Lessons Table is enabled:
- Lesson Name - Name of lesson.
- Sub-Category name will display when drilling into the Lesson Name.
- Course Progress - Displays Not Started if the learner has yet to make progress in the course. Displays the percentage of the course the learner has completed once started and the number of lessons completed. Course progress is determined by the Study Plan progress within the course. If a Study Plan is not used it is determined by the number of content items completed with the course divided by available content items.
- Confidence Level - Displays the confidence level of the lesson i.e. high, medium, and low.
- Last Completed At - Can be calculated at category level, sub-category level, and at the lesson level. At the category level, it displays the last time a lesson was completed within that category. At the sub-category level, it displays the last time a lesson within that specific sub-category was last completed. At the lesson level, it displays the most recent completion date of the lesson.

The Lessons Table is a sub-feature of the Lessons Tab, to learn more about how to manage this feature please click here.
You also have the ability to Export the data from this page. Simply click on the Export button above the Name column and the CSV will be generated and sent to you via email.
Exam Analytics
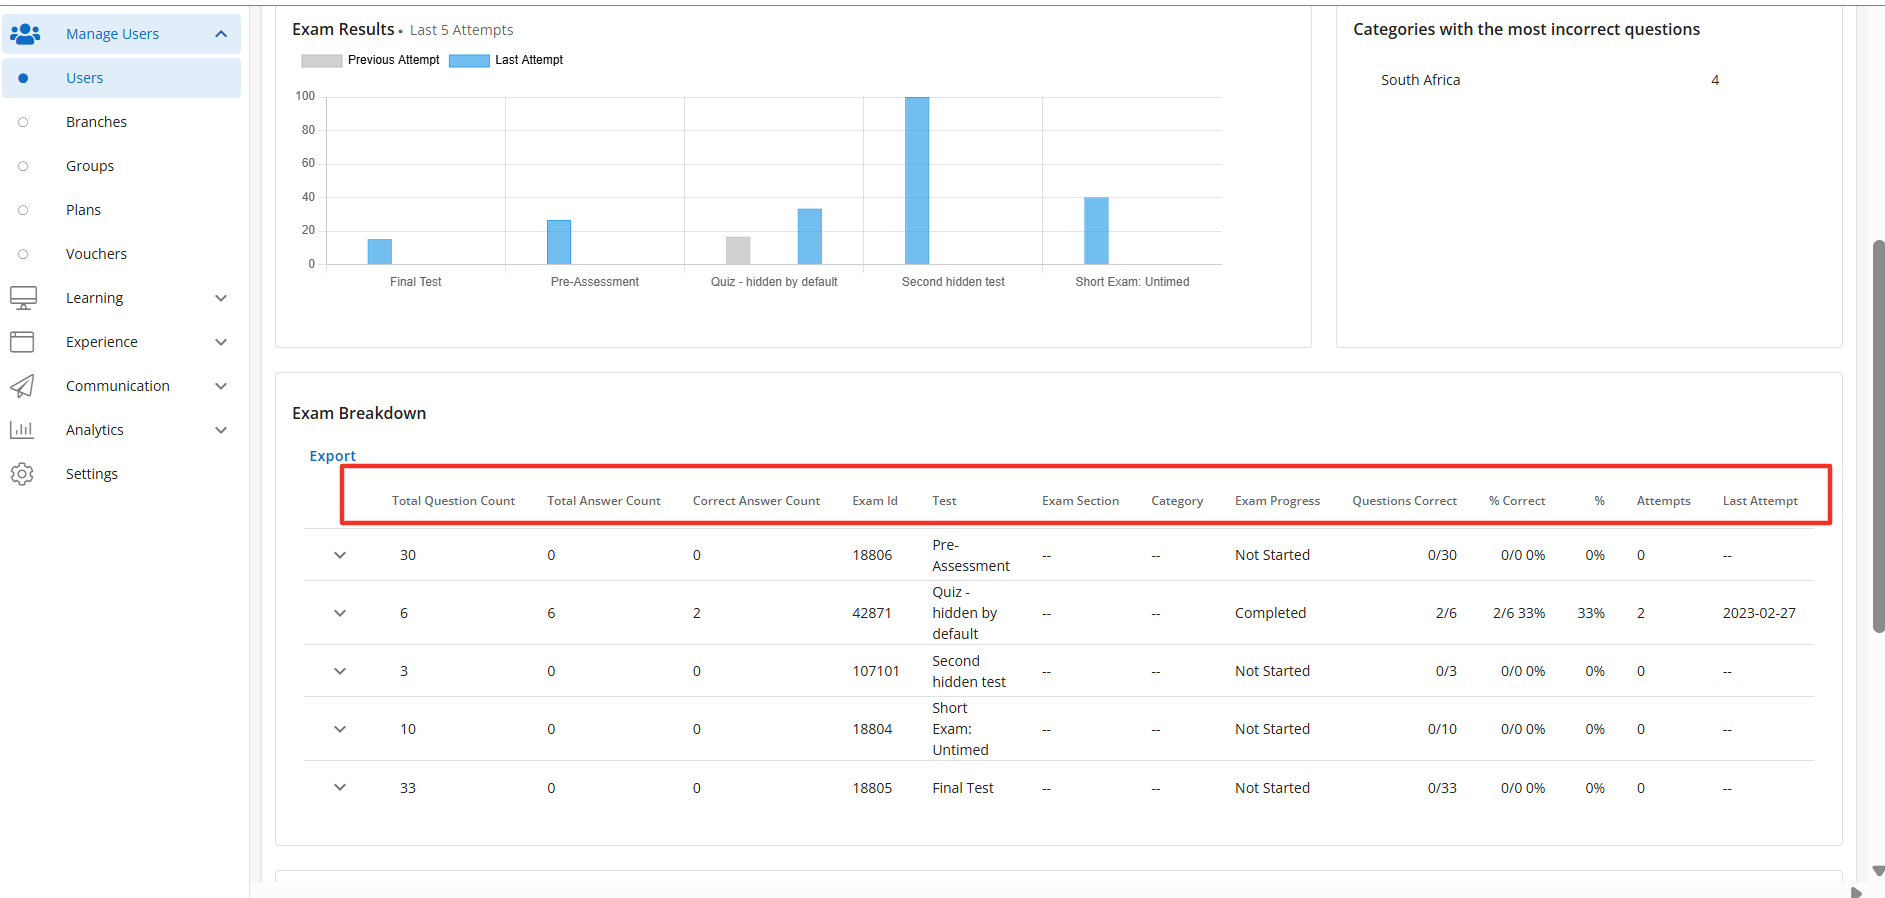
When the Exam tab is enabled it displays the following fields when the Exam Table Report is enabled:
- Total Questions Count - The total number of questions available on the exam.
- Total Answer Count - The total number of questions answered on the exam.
- Correct Answer Count - The total number of correct answers on the exam.
- Exam ID - The id of the exam.
- Test- Name of the Exam.
- Exam Section - Name of the Exam Section (if applicable).
- Category - The name of the question category.
- Exam Progress - Displays the exam as Not Started, In Progress, or Completed.
- Questions Correct - The number of questions correct out of the total number of questions.
- % Correct - Display the number of questions correct and the percentage of correct questions.
- % - The percentage of questions the learner correctly answered.
- Attempts - Displays the number of attempts
- Last Attempt - Displays the date of the last attempt.
The Exam Reports Table is a sub-feature of the Exam Report Tab, to learn more about how to manage this feature please click here.
You also have the ability to Export data from the Exam Report Table. Simply click on the Export button above the Name column and the CSV will automatically download.
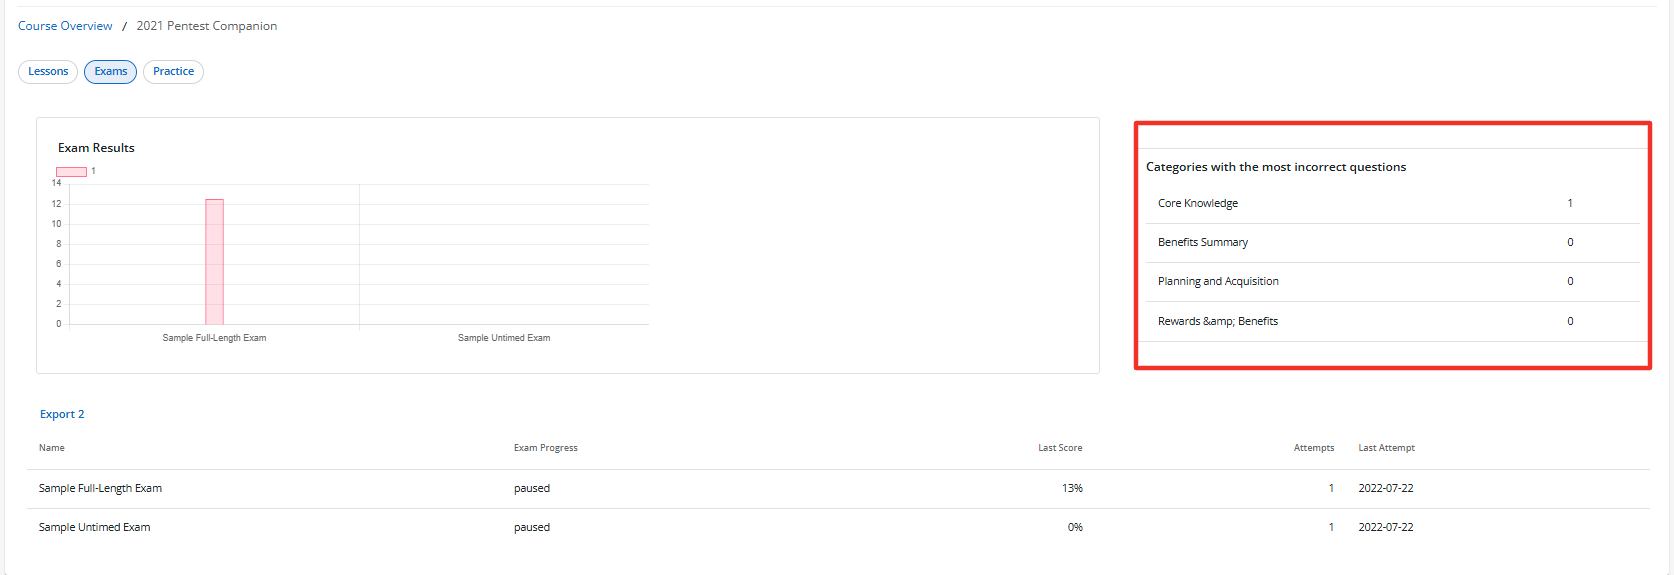
The Exam Tab also displays a listing widget that displays the Categories with the most incorrect questions for a quick overview of the top 5 questions categories with the most incorrect corrections. The widget will display the name of the categories and how many questions were missed in the category. This provides a quick overview of question category performances.
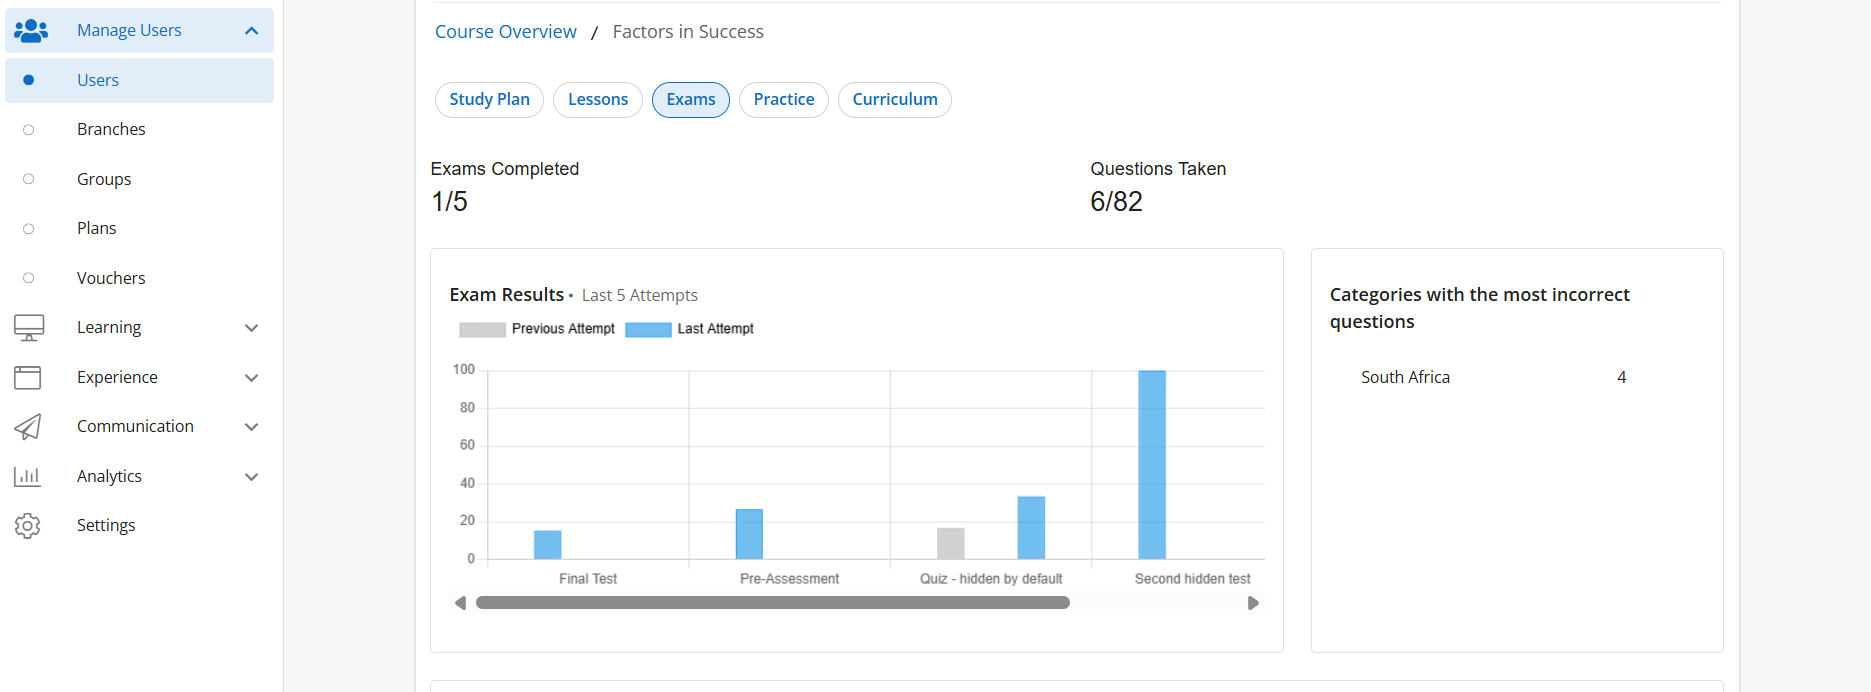
When the Exam Report User Attempts Chart is enabled it will display in the Exam Tab. The Exam Report User Attempt Chart displays the Exam Name and the last five attempts the user had on their exams and their score for each attempt. The last attempt on the users exam will display as blue on the graph and the previous attempts will display as grey as seen in the screenshot below. Only completed attempts are included. If an exam is paused, then was reset the attempt will not be included in the count or in the calculation.
The Exam Report User Attempt Chart is a sub-feature of the Exam Report Tab, to learn more about how to manage this feature please click here.
You also have the ability to Export data from this page. Simply click on the Export button above the Name column and the CSV will automatically download.
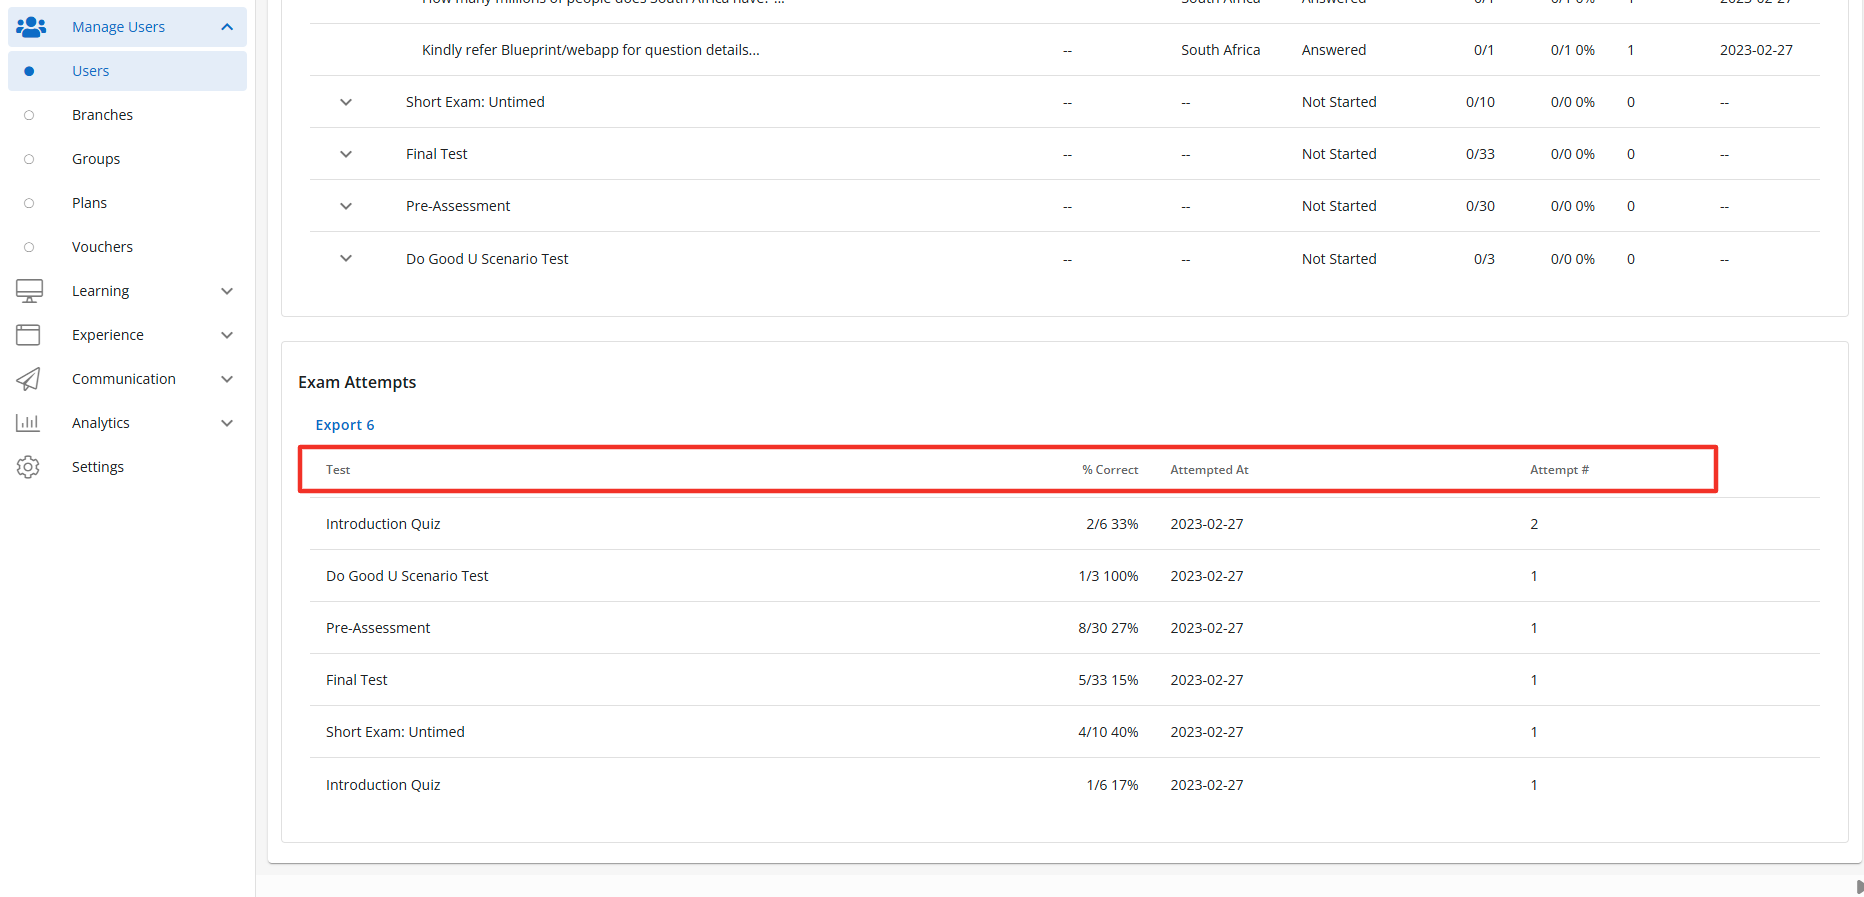
The Exam Tab can also display the Exam Attempts Table when enabled. Only completed attempts are included. If an exam is paused, then was reset the attempt will not be included in the count or in the calculation. To view questions in the exam click on the exam expander. The Exam Attempts table will display the following fields by default:
- Test- Name of the Exam.
- % Correct - The percentage of questions the learner correctly answered.
- Attempted At - Displays the number of attempt
- Attempt # - Displays the number of total attempts.
Optional Fields to toggle on:
- Exam id - The id of the exam.
- Predicted Scores - An estimated score calculated from a learner's current performance.
- Total Answers Count - The total number of answers.
- Total Correct Count - The total number of correct answers.
The Exam Report Attempts Table is a sub-feature of the Exam Report Tab, to learn more about how to manage this feature please click here.
When the feature access Completed Exam Count Data Point is enabled an Exams Completed widget will display within the learner's Course Overview page. The Exam Completed widget displays how many exams the learners has completed in the course. So for example the learner in the screenshot below has only completed 1 out 5 exams that are available in the selected course.
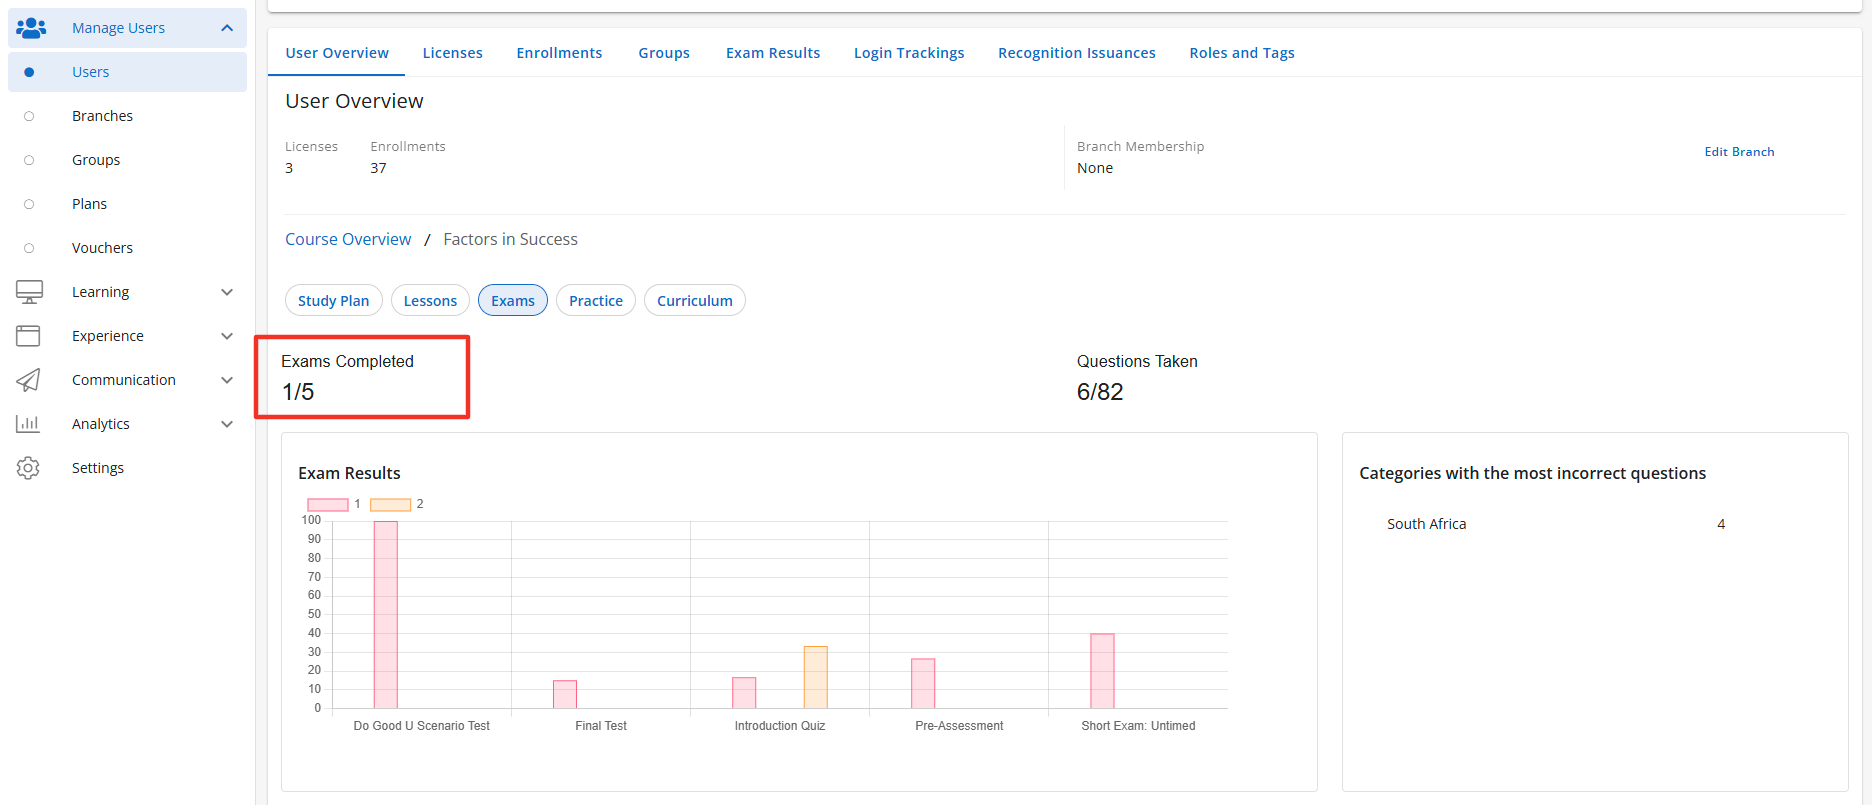
The Completed Exam Count Data Point is a sub-feature of the Exam Report Tab, to learn more about how to manage this feature please click here.
When the feature access Questions Taken Data Point is enabled a Questions Taken widget will display within the learner's Course Overview page. The Questions Taken widget displays how many exam questions the learner has completed in the course. So for example the learner in the screenshot below has only completed 6 out 82 questions available in the course exams.
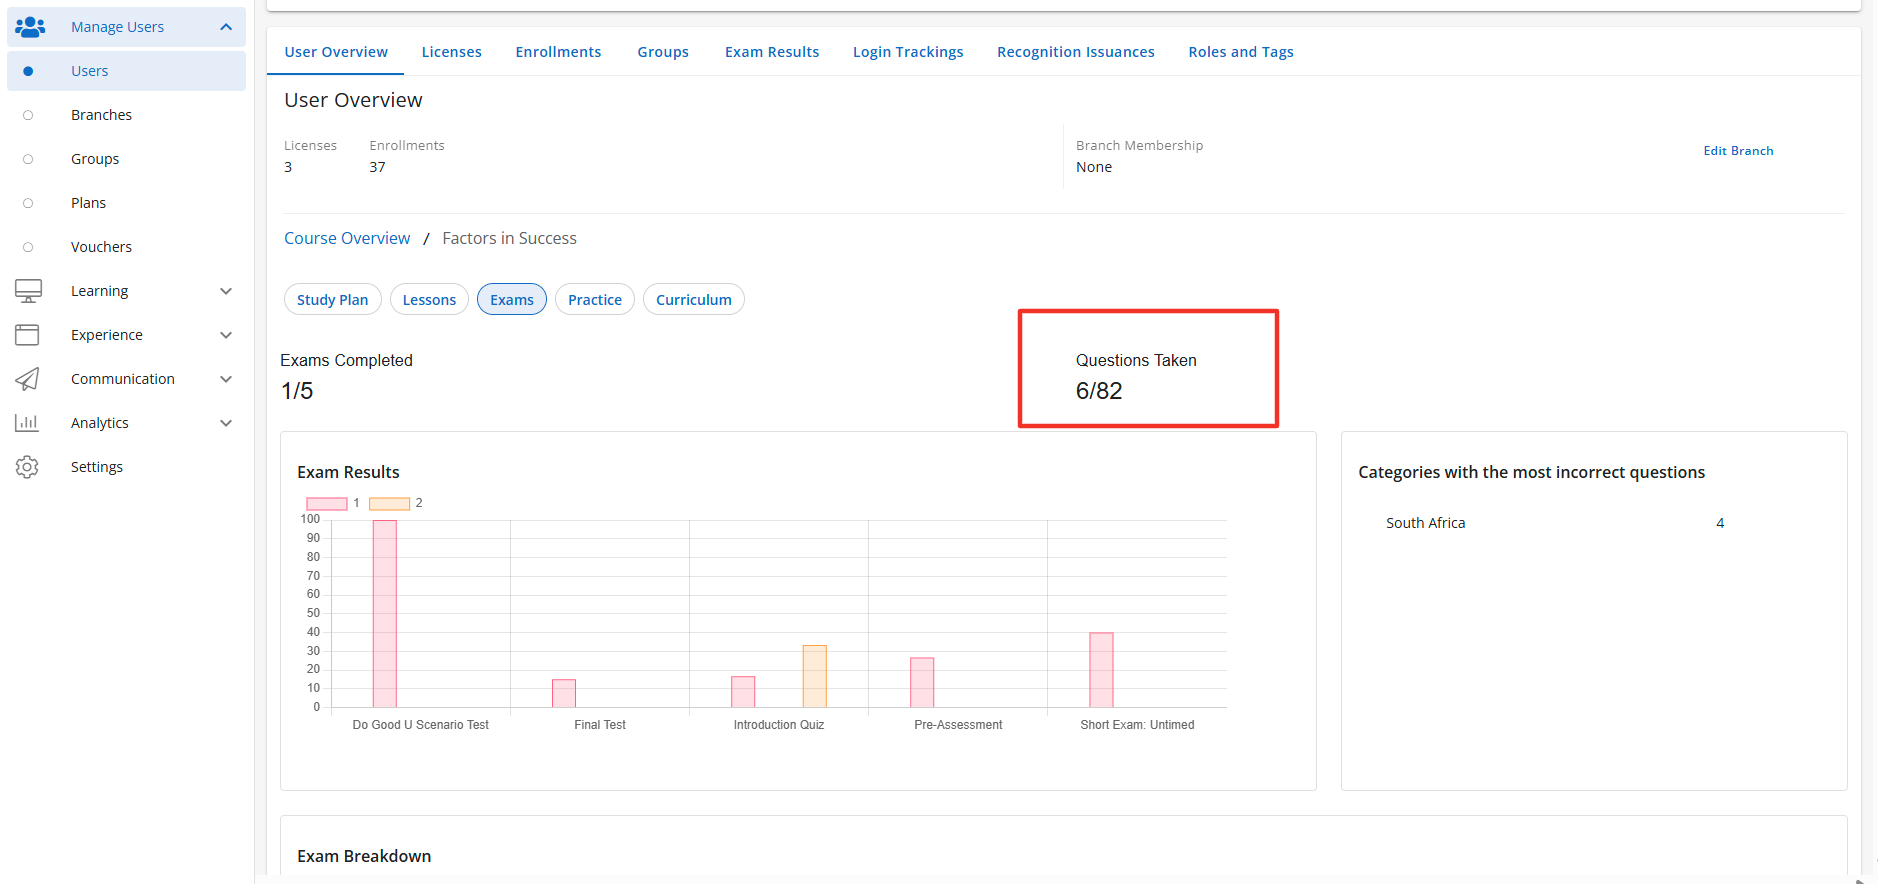
The Questions Taken Data Point is a sub-feature of the Exam Report Tab, to learn more about how to manage this feature please click here.
Practice Analytics
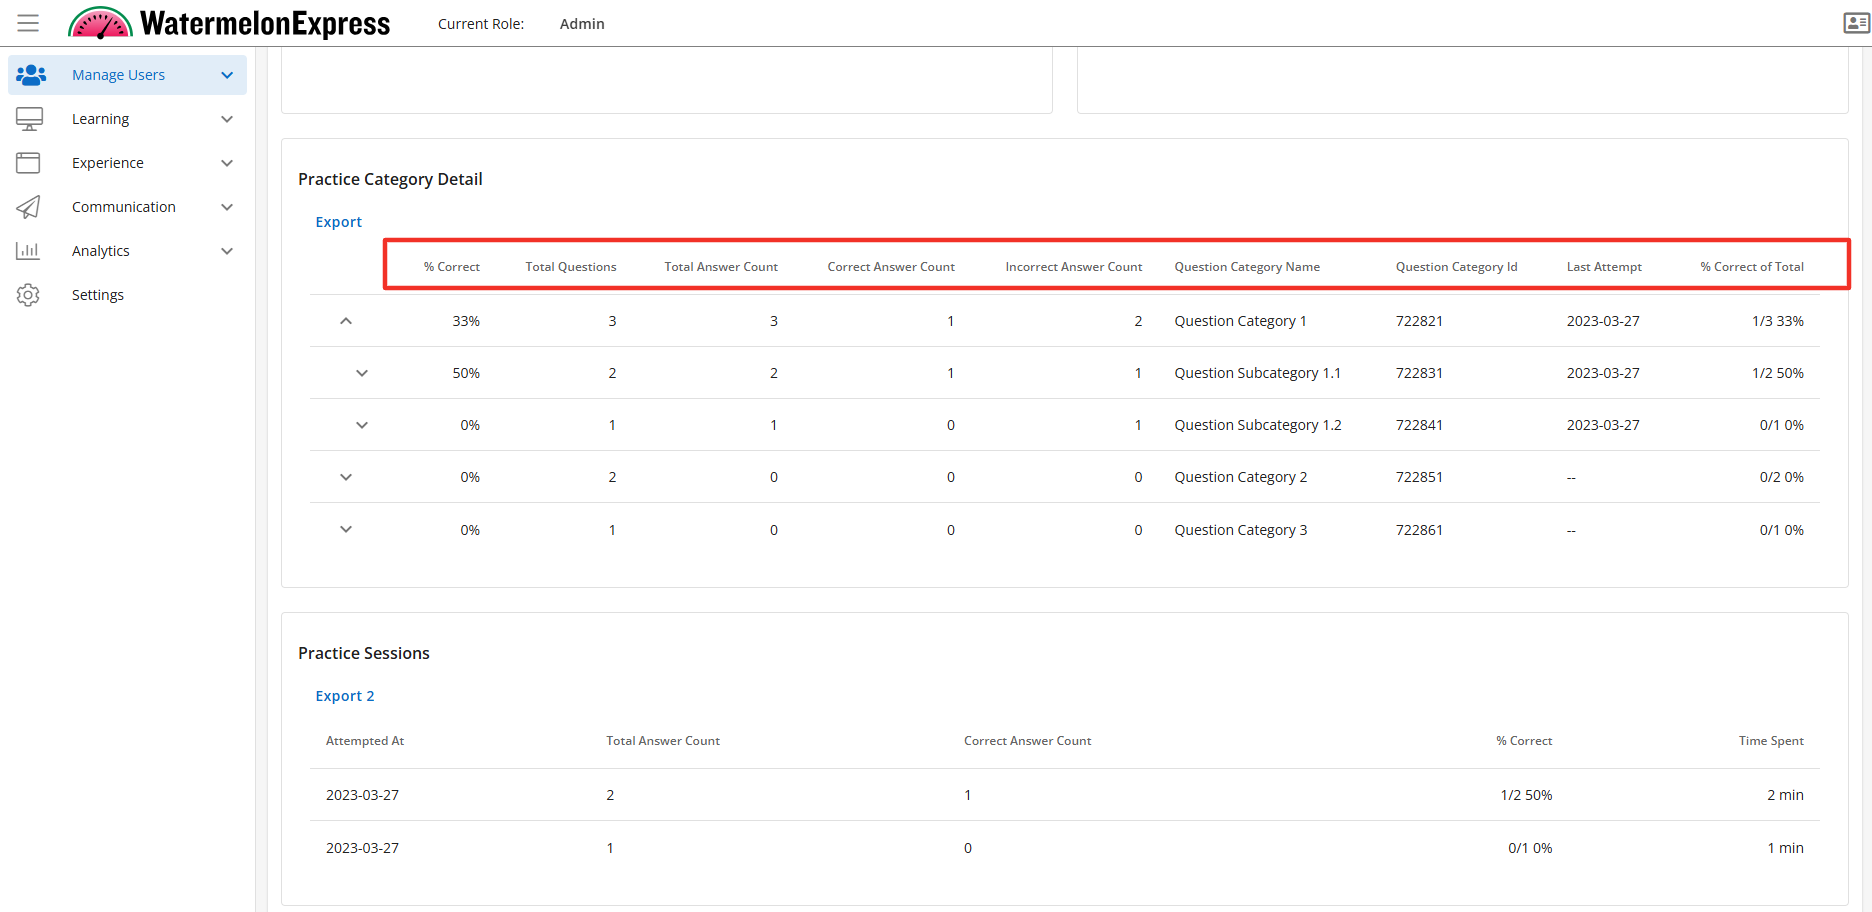
The Practice tab displays the following fields when the Practice Table is enabled:
- % Correct - Percentage of questions correct.
- Total Questions - Total questions seen by the learner.
- Total Questions Answer - Total questions answered by the learner.
- Correct Answer Count - The number of correct answers the learner completed.
- Incorrect Answer Count - The number of incorrect answers the learner completed.
- Question Category Name - The name of the question category.
- Questions Category ID - Displays the BluePrint id of the question category.
- Last Attempt - The date the user last attempted Practice questions in the Question Category or Sub Category.
- % Correct of Total- Displays the number of questions correct out of the total number of questions and displays the percentage correct for those questions.
The Practice Table is a sub-feature of the Practice Report Tab, to learn more about how to manage this feature please click here.
You also have the ability to Export the data from the Practice Table. Simply click on the Export button above the Name column and the CSV will be generated and sent to you via email.
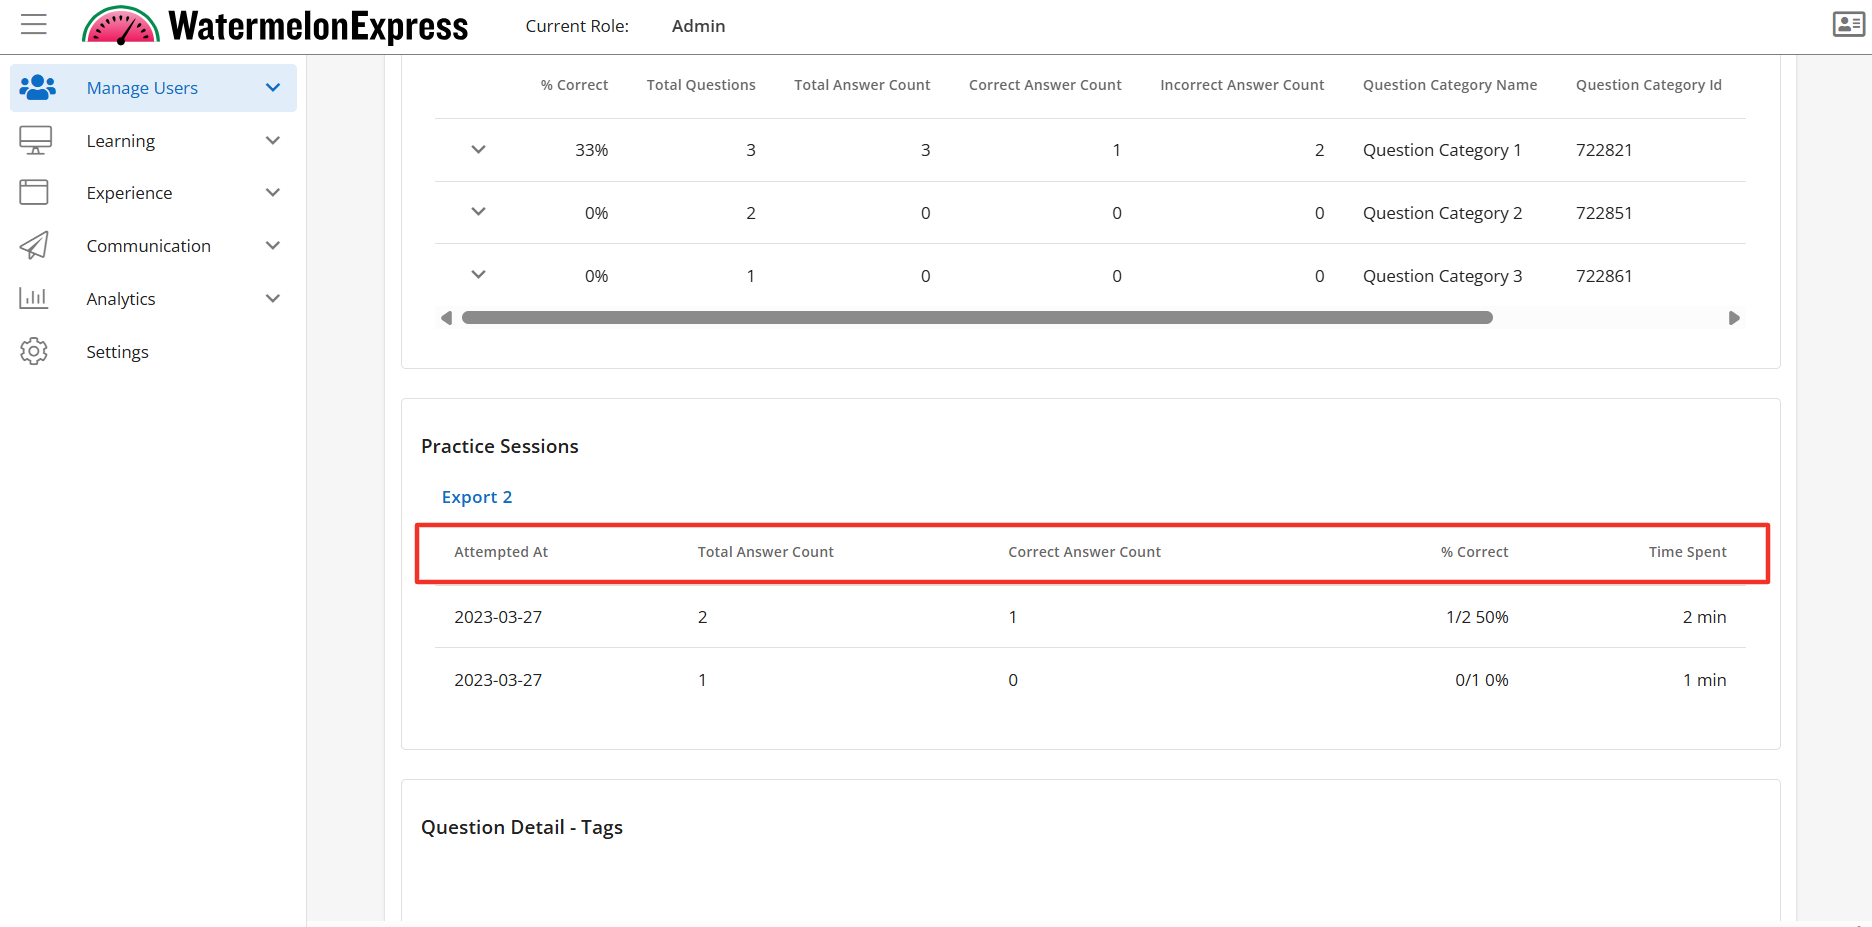
When enabled the Practice Tab displays the User Practice Sessions table. The User Practice Sessions displays a table that shows the leaners data based on each of their sessions. When enabled the User Practice Sessions displays the following fields:
- Attempted At - The date the learner attempted the practice session.
- Total Answer Count - The number of questions the learner answered during a session.
- Correct Answer Count - The number of questions the learner correctly answered during a session.
- % Correct - The percent of questions the learner correctly answered during a session.
- Time Spent - The total time spent in minutes the learner spent in the session.
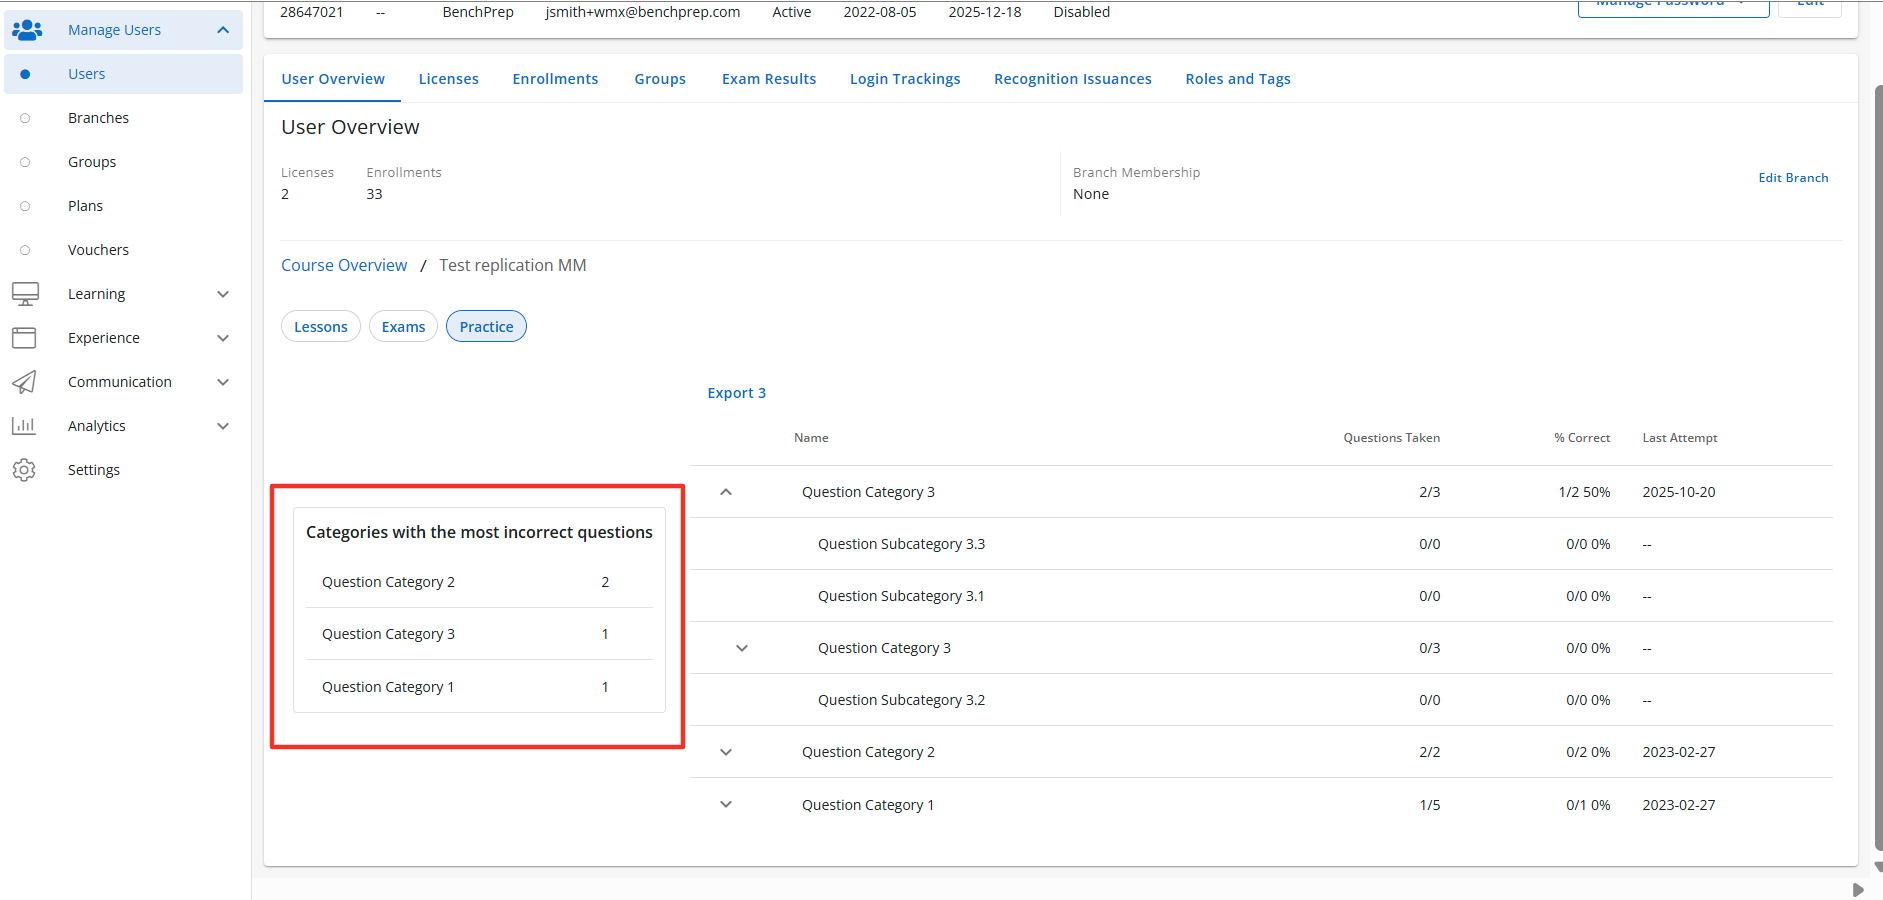
The Practice Tab also displays a listing widget that displays the Categories with the most incorrect questions for a quick overview of the top 5 questions categories with the most incorrect corrections. The widget will display the name of the categories and how many questions were missed in that category. This provides a quick overview of question category performances.
The Practice Tab can also display a listing widget that displays the Most Incorrect Tags List. Which is similar to the Categories with the 5 most incorrect questions but it displays the top lowest performing questions based on tags. The widget will display the name of the tags and how many questions were missed that were associated to the tag.
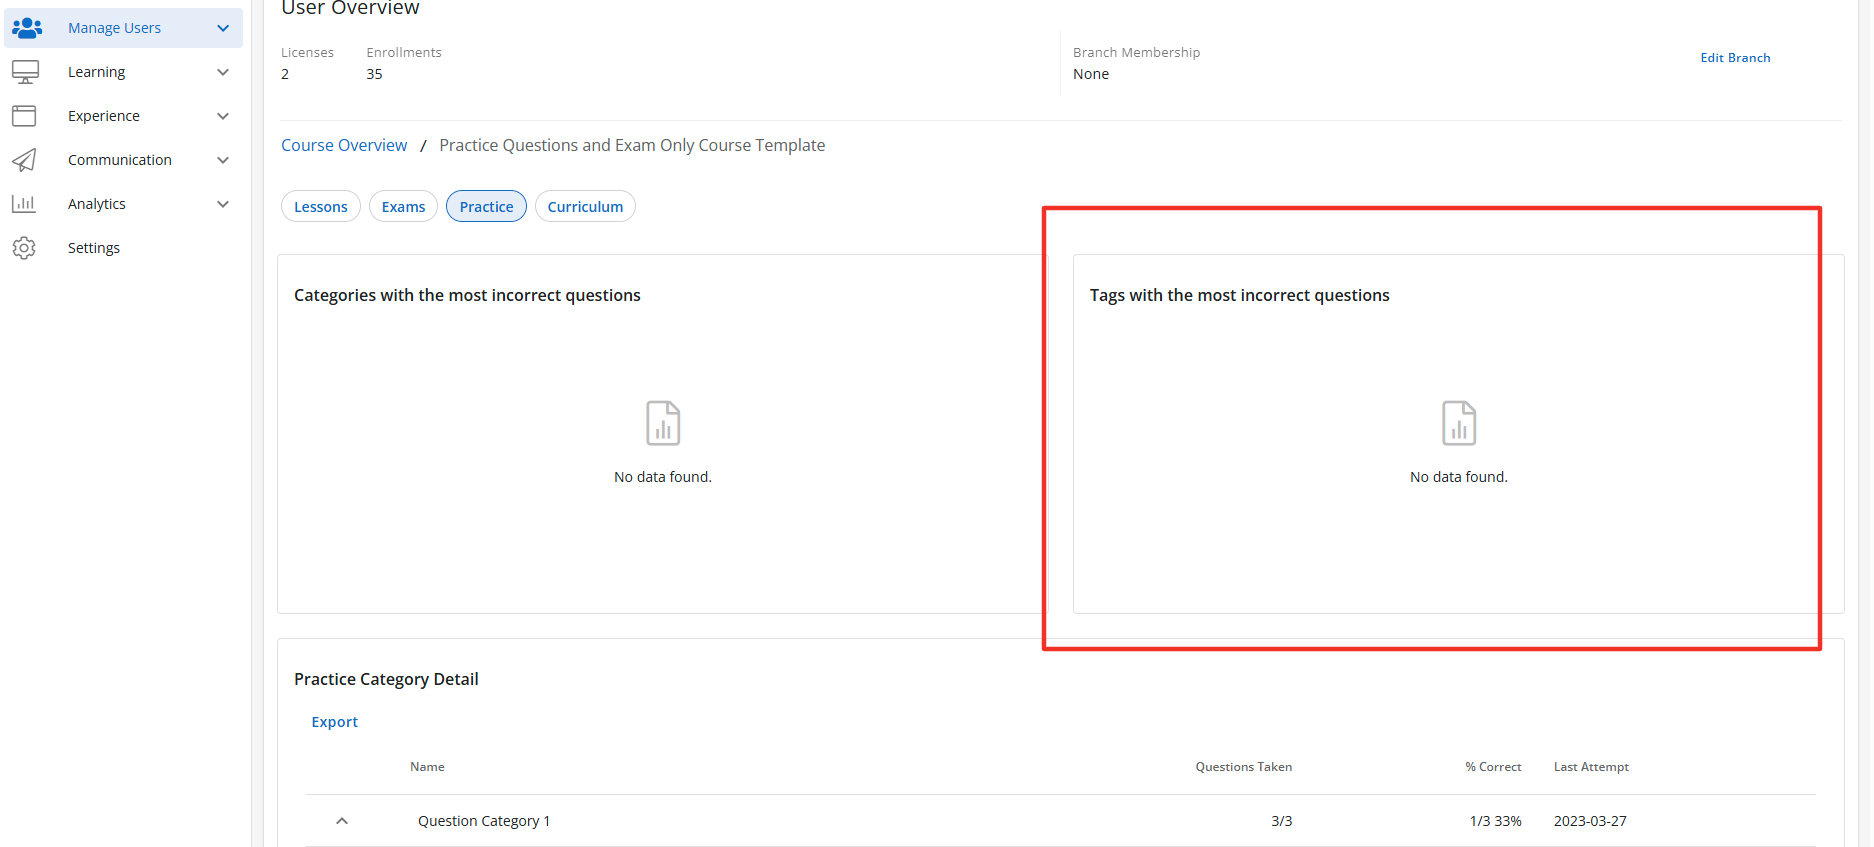
The Most Incorrect Tags List is a sub-feature of the Practice Tab, to learn more about how to manage this feature please click here.
When the feature access Questions Taken Data Point is enabled a Questions Taken widget will display within the learner's Course Overview page. The Questions Taken widget displays how many practice questions the learner has completed in the course. So for example the learner in the screenshot below has only completed 22 out 106 questions available in the course exams.
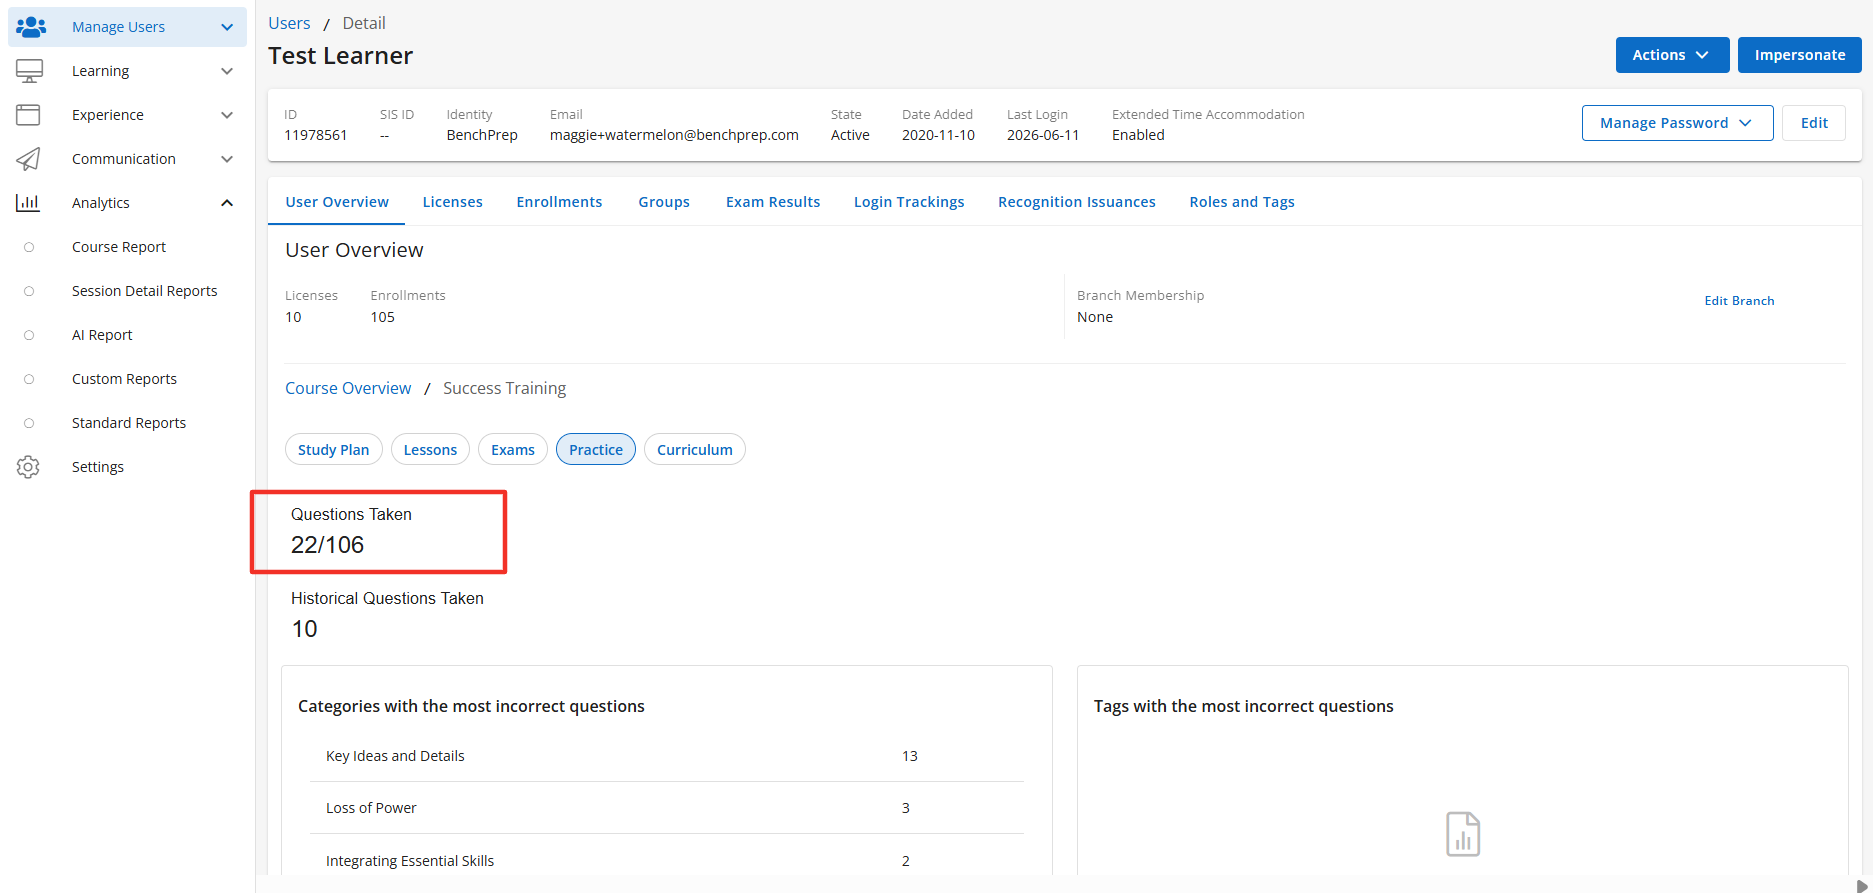
The Questions Taken Data Point is a sub-feature of the Practice Report Tab, to learn more about how to manage this feature please click here.
When the Custom Practice Questions Taken Data Point feature access is enabled, the Practice tab will display the Historical Questions Taken field. This data point displays the total number of unique Custom Practice questions a learner has completed. Each question is counted only once, even if it is reset and completed again. Questions completed in Category Practice are not included.
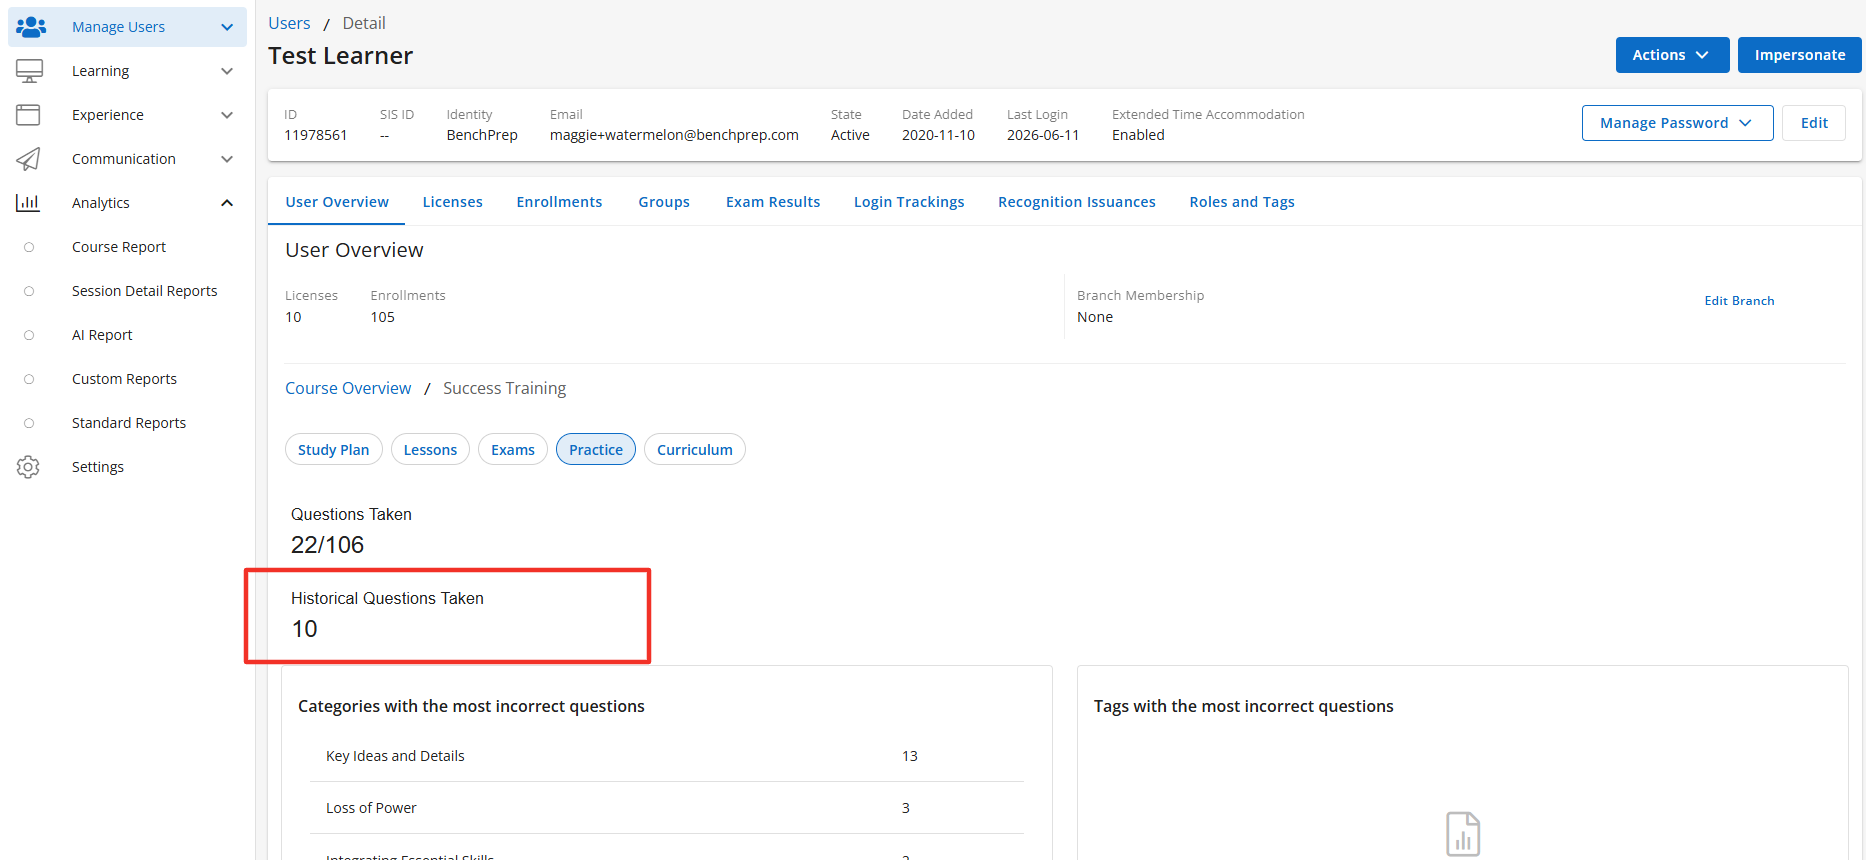
The Custom Practice Questions Taken Data Point is a sub-feature of the Practice Tab, to learn more about how to manage this feature please click here.
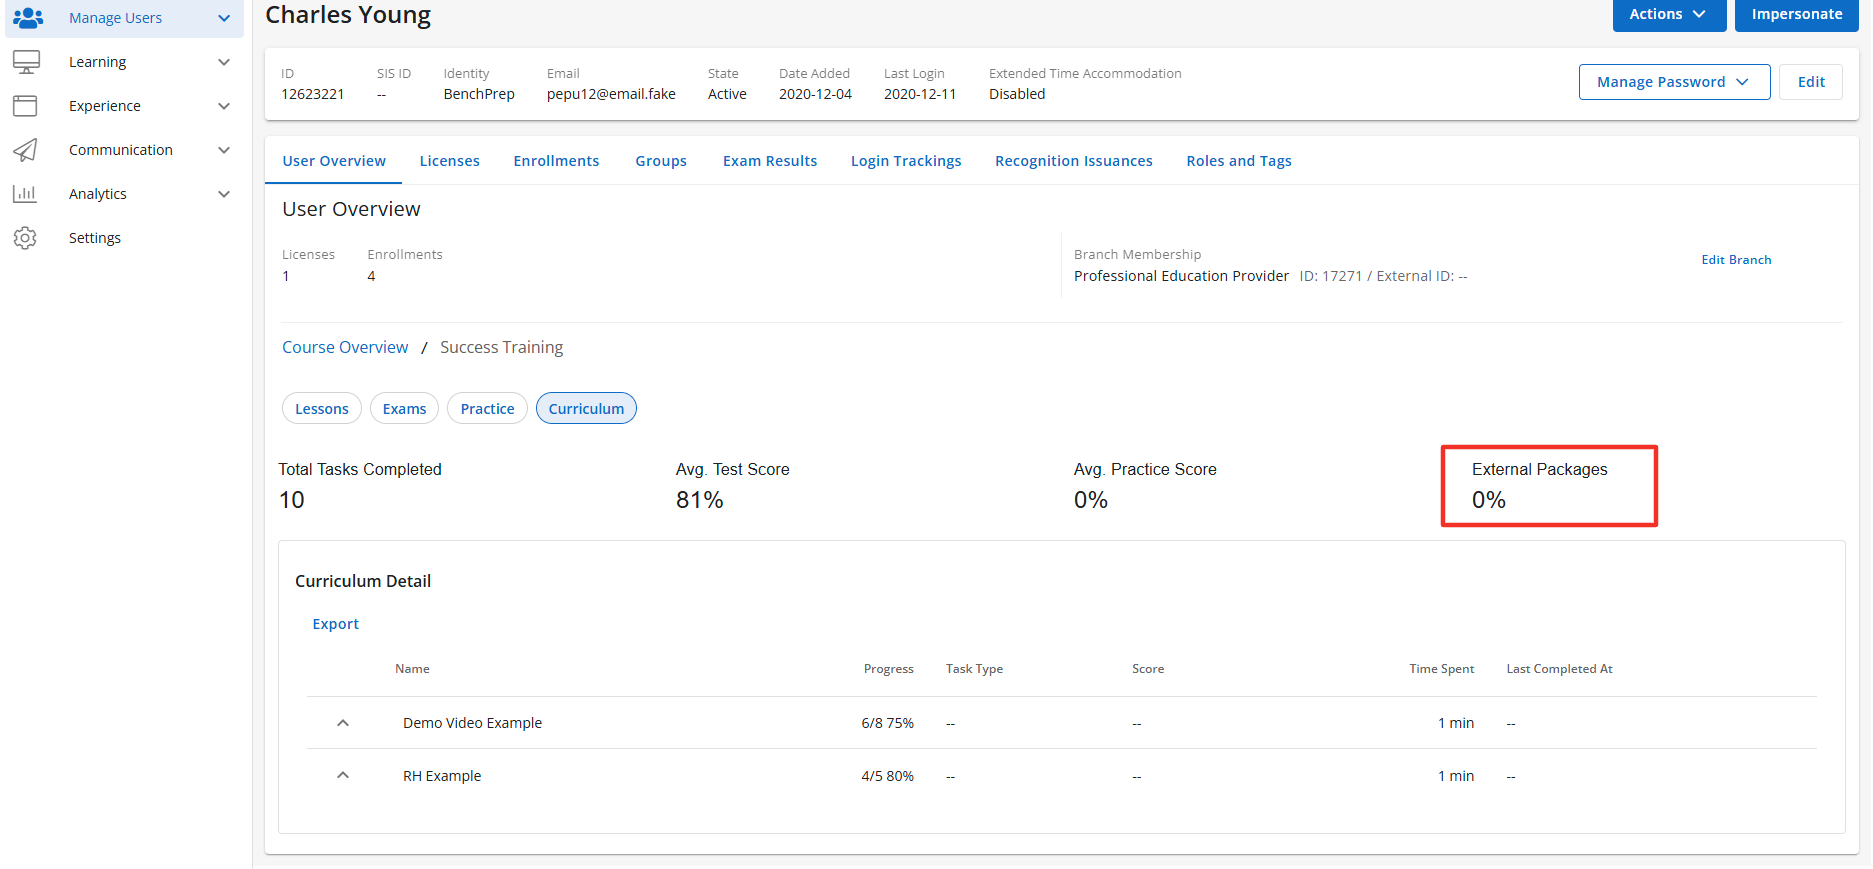
Curriculum Analytics
When the Curriculum tab is enabled it displays multiple sub-features. When the Curriculum Report Table is enabled the following fields will display in the Curriculum Report Table:
- Name - Name of the Curriculum. When drilling down into the curriculum it will display the name of the tasks within the curriculum.
- Task Type - Displays the type of task the learner completed like lessons, Exams, and Practice Questions.
- Score - Displays the learner's score on the curriculum or task.
- Total Time Spent - Is the total time the learner spent in the curriculum.
- Last Completed At - Displays the date a learner last completed a task.
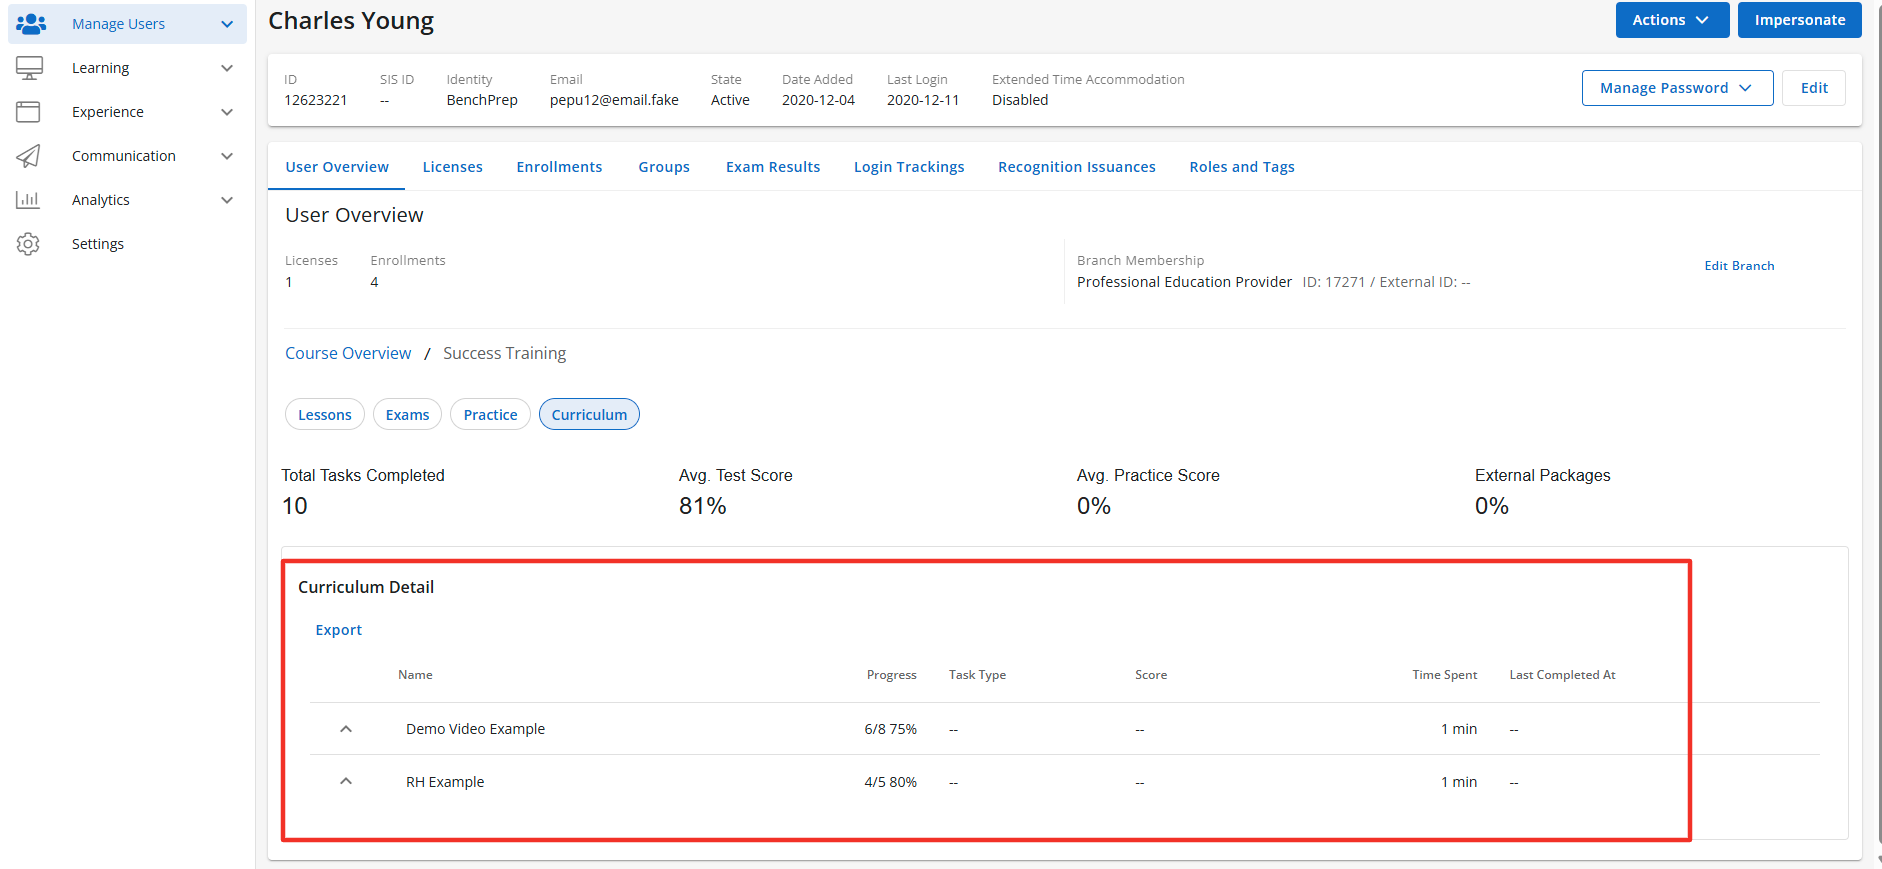
The Curriculum Table is a sub-feature of the Curriculum Tab, to learn more about how to manage this feature please click here.
The Curriculum Tab can also display the Total Task Completed in the curriculum. Any task the learner has completed will display in the count for Total Task Completed. Incomplete task will not display in the data point.
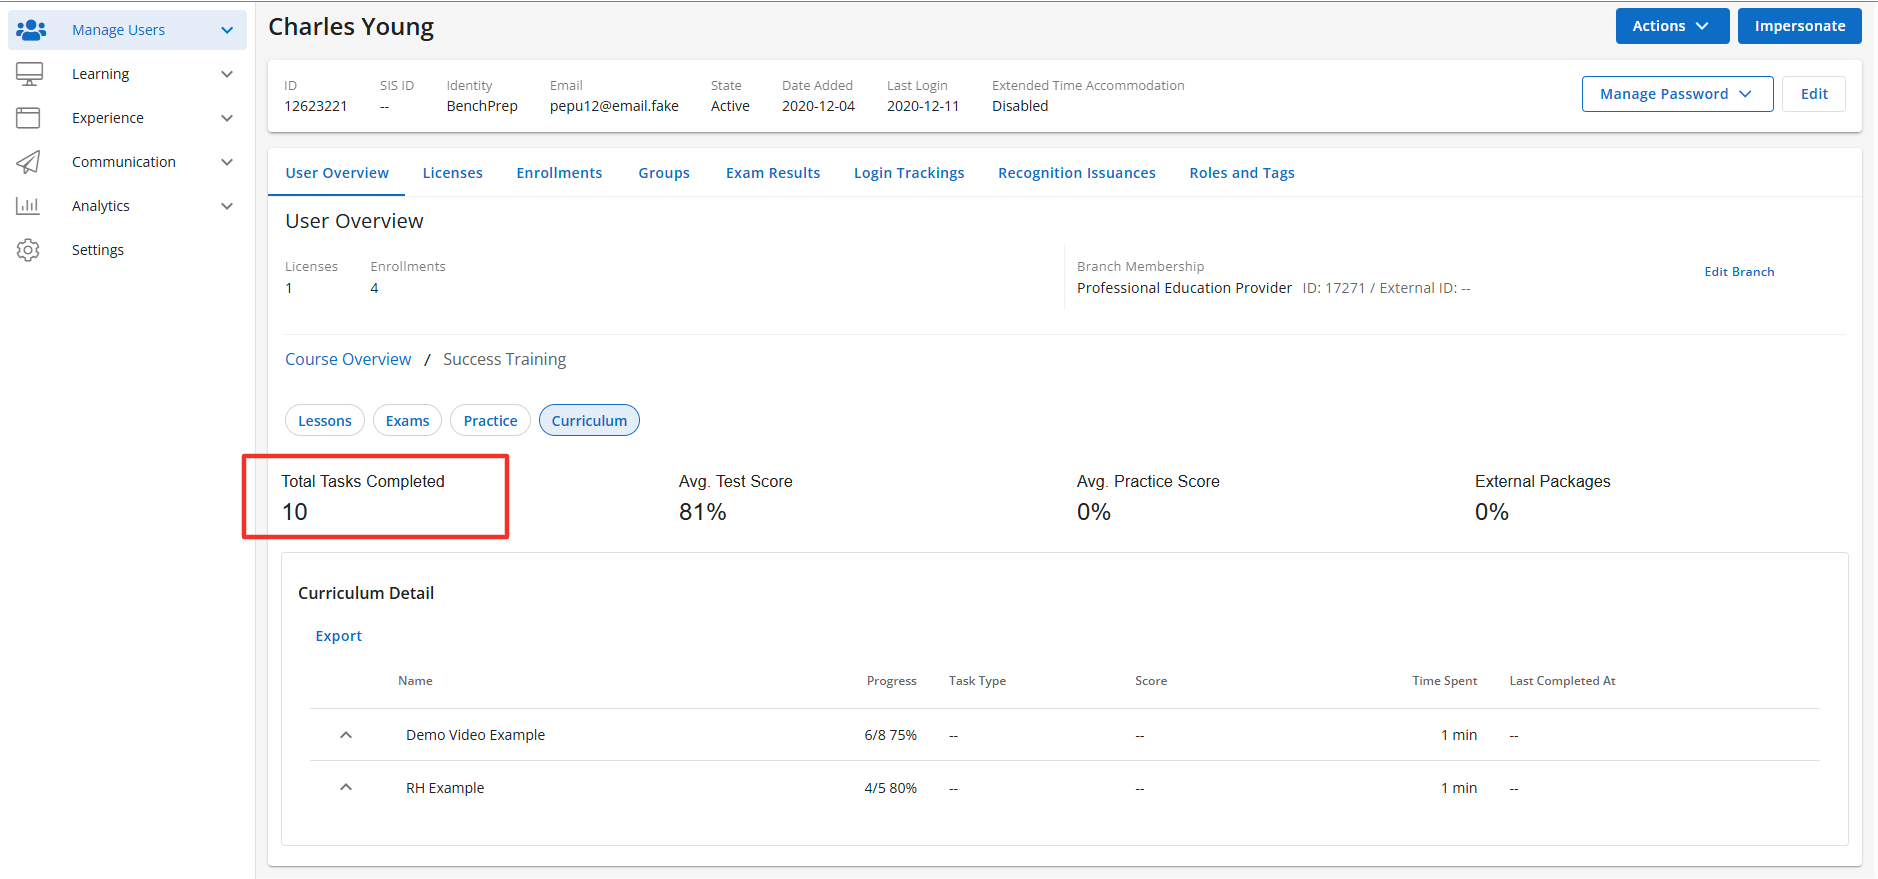
The Total Task Completed is a sub-feature of the Curriculum Tab, to learn more about how to manage this feature please click here.
The Curriculum Tab will also display the Average Test Score of the learner. The percentage shown is the average score the leaner received after completing any tests within the curriculum. Paused tests are not factored into the average test score.
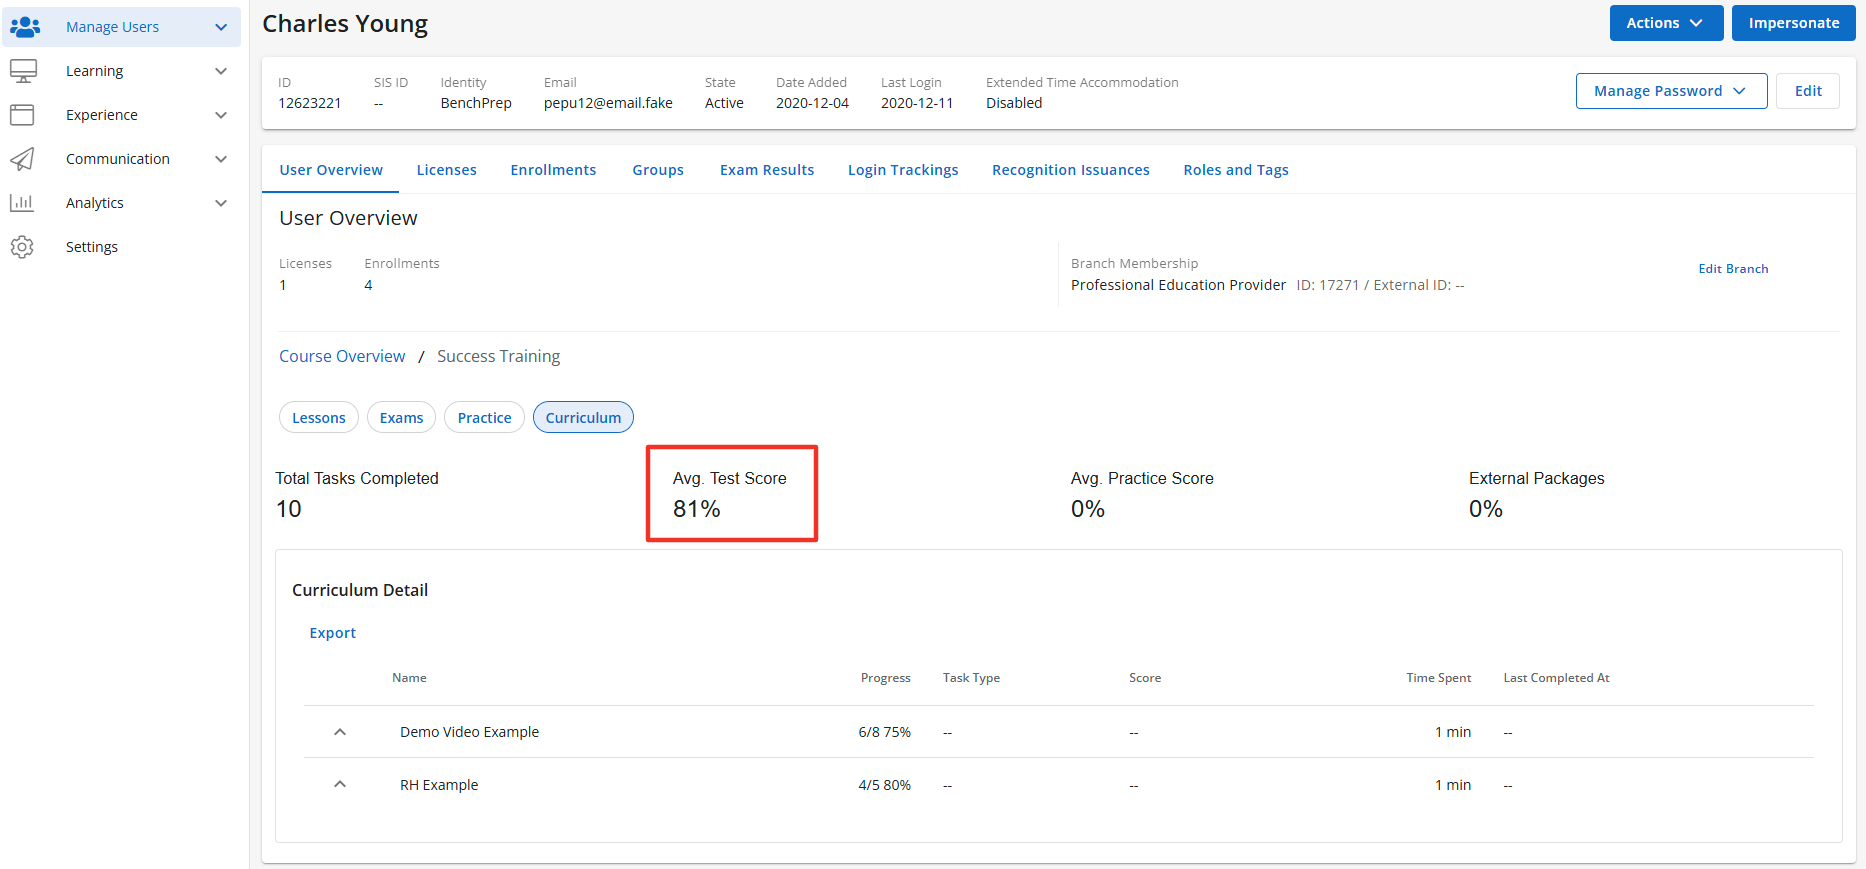
The Avg. Test Score is a sub-feature of the Curriculum Tab, to learn more about how to manage this feature please click here.
The Curriculum Tab will also display the Average Practice Score of the learner. The percentage shown is the average score the leaner received after completing any practice questions within the curriculum.
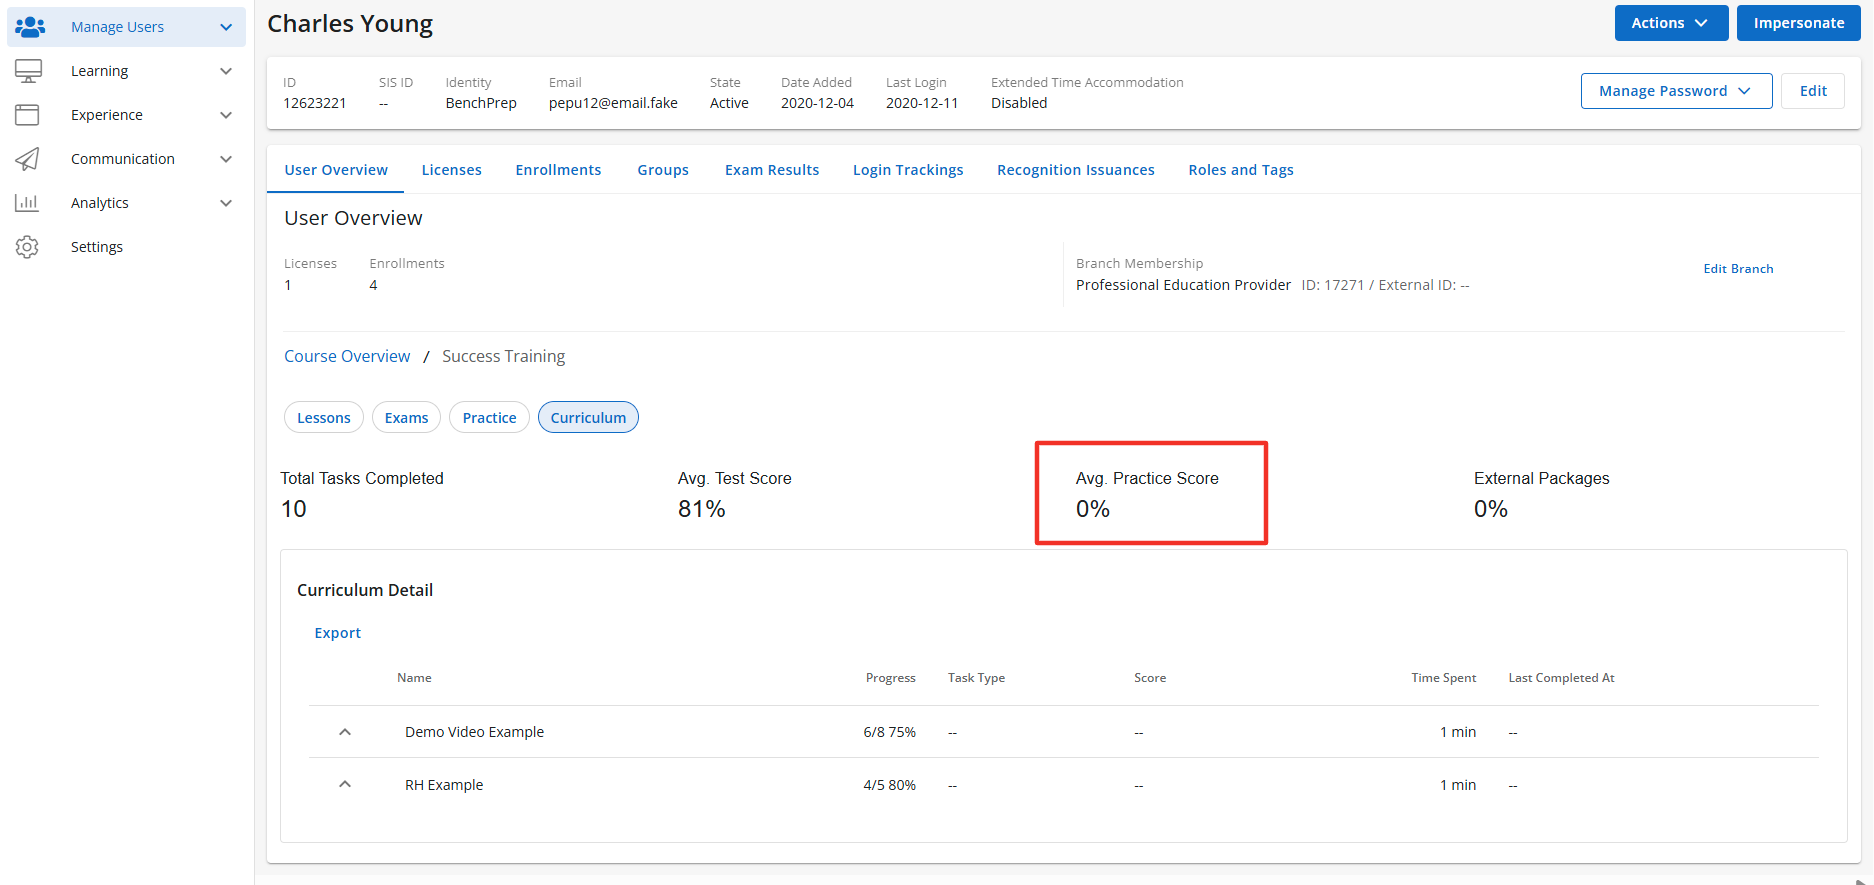
The Avg. Practice Score is a sub-feature of the Curriculum Tab, to learn more about how to manage this feature please click here.
The Curriculum Tab will also display the External Packages of the learner. The percentage shown is the average progress across all external packages.
The External Packages is a sub-feature of the Curriculum Tab, to learn more about how to manage this feature please click here.
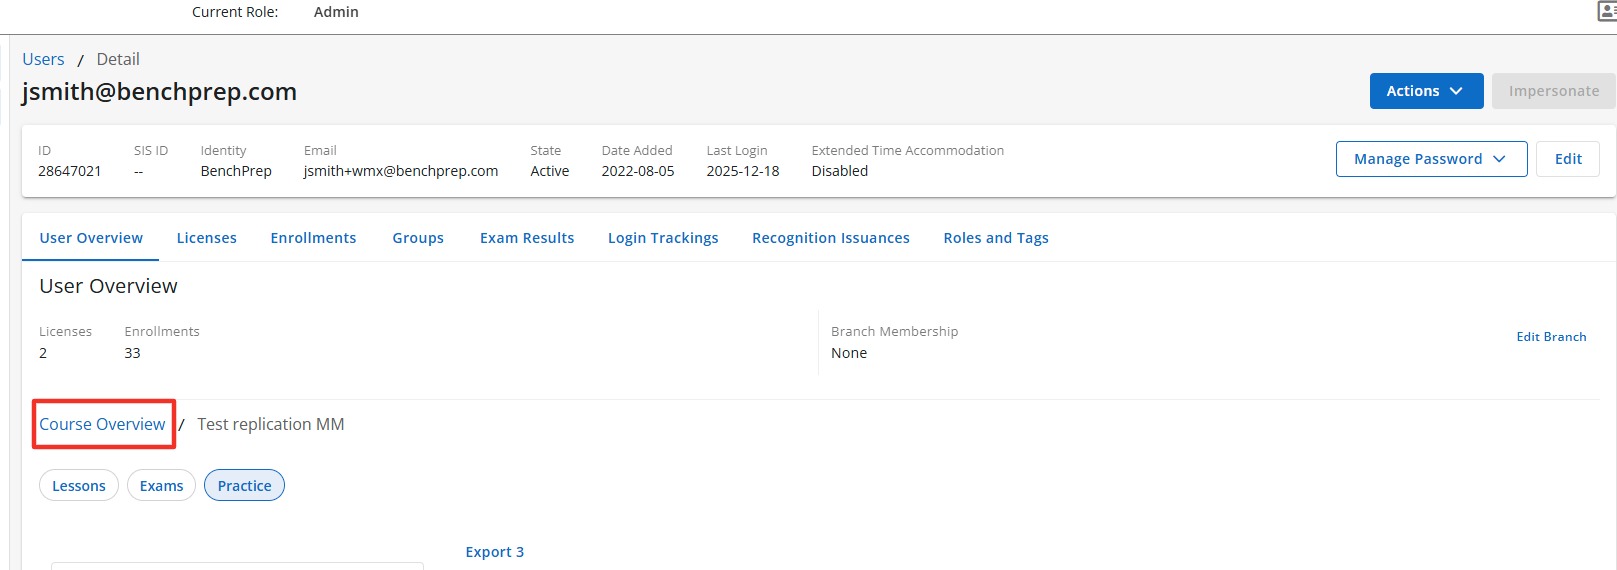
To navigate back to the learner’s courses click on the Course Overview link above the Lesson, Exam, and Practice tab.
Viewing Branch Insights
Users with a custom role with the “Read Branches” and "Read Reports'' permissions will have access to the Branch Detail page and the Groups Overview and User Detail Breakdown tabs, scoped to the level the role is assigned at. Users with a Console Admin role will see all users in the tenant.
If you’re a Group Manager, an Instructor of multiple groups, or have custom roles with group-level permissions, you’ll see learner data only for the group scope you have selected. To view learners in another group, simply switch your access context. To learn how to switch context between roles please click here.
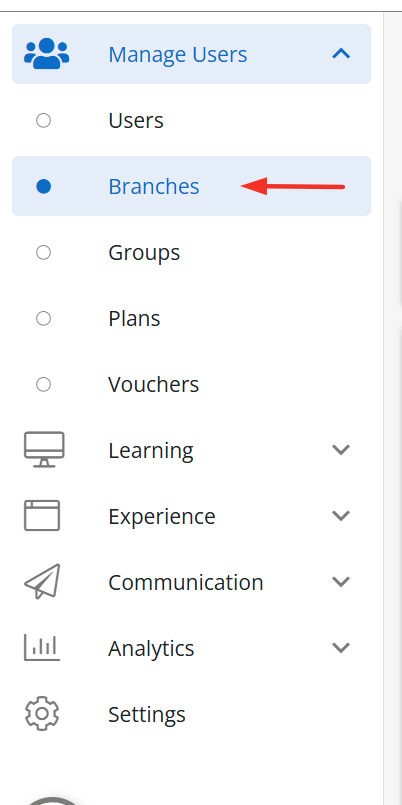
To view data for a Branch under your purview, follow these steps:
Open Console and select Branches under Manage Users, then use the filter to select the Branch you want to view.
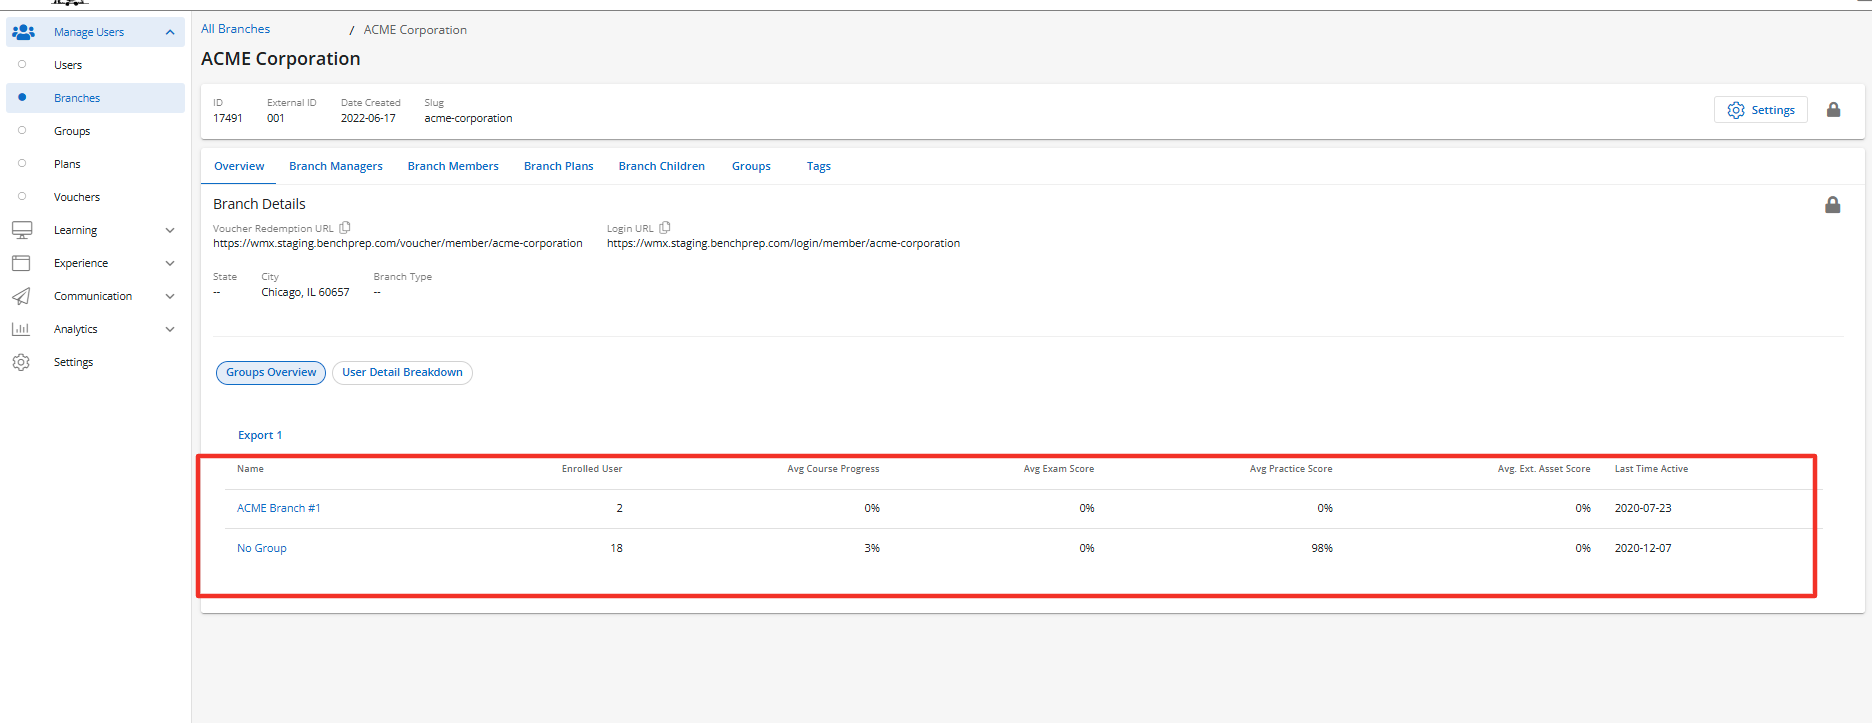
The Branch Detail page will display an overview of the branch's details. To learn more the branch details and managing branches click here.
The Group Overview section will display following fields when the Group Table is enabled:
- Name - Name of the group.
- Enrolled Users - Number of enrolled learners in a group.
- Avg. Course Progress - Average course progress by all learners in each group. Course progress is determined by the Study Plan progress within the course. If a Study Plan is not used it is determined by the number of content items completed with the course divided by available content items.
- Avg. Exam Score - Displays the average exam scores (factoring “percent correct” score from exams in started, paused and completed states, including reset exams), averaged across all enrollments for each group.
- Avg. Practice Score - Averages out the practice scores across all learners in the group. The calculation involves taking the sum of practice scores, which includes correct, incomplete, and total answers recorded in practice sessions, and dividing it by the total number of practice sessions. This average is calculated across all enrollments within the group.
- Last Time Active - Displays the last time a learner completed an activity in the selected group. An activity consists of taking action (i.e. completing, creating, editing, or deleting) for one of the following:
- Confidence levels (lessons, flashcards, or questions)
- Practice questions
- Exams
- Essays
- Bookmarks
- Highlights
- Notes
- Resets (practice questions or exams)
- Continuous learning cycle (if applicable
The Group Table is a sub-feature of the Group Overview Tab, to learn more about how to manage this feature please click here.
You also have the ability to Export the data from this page. Simply click on the Export button above the Name column and the CSV will be generated and sent to you via email.
Branch Level User Analytics
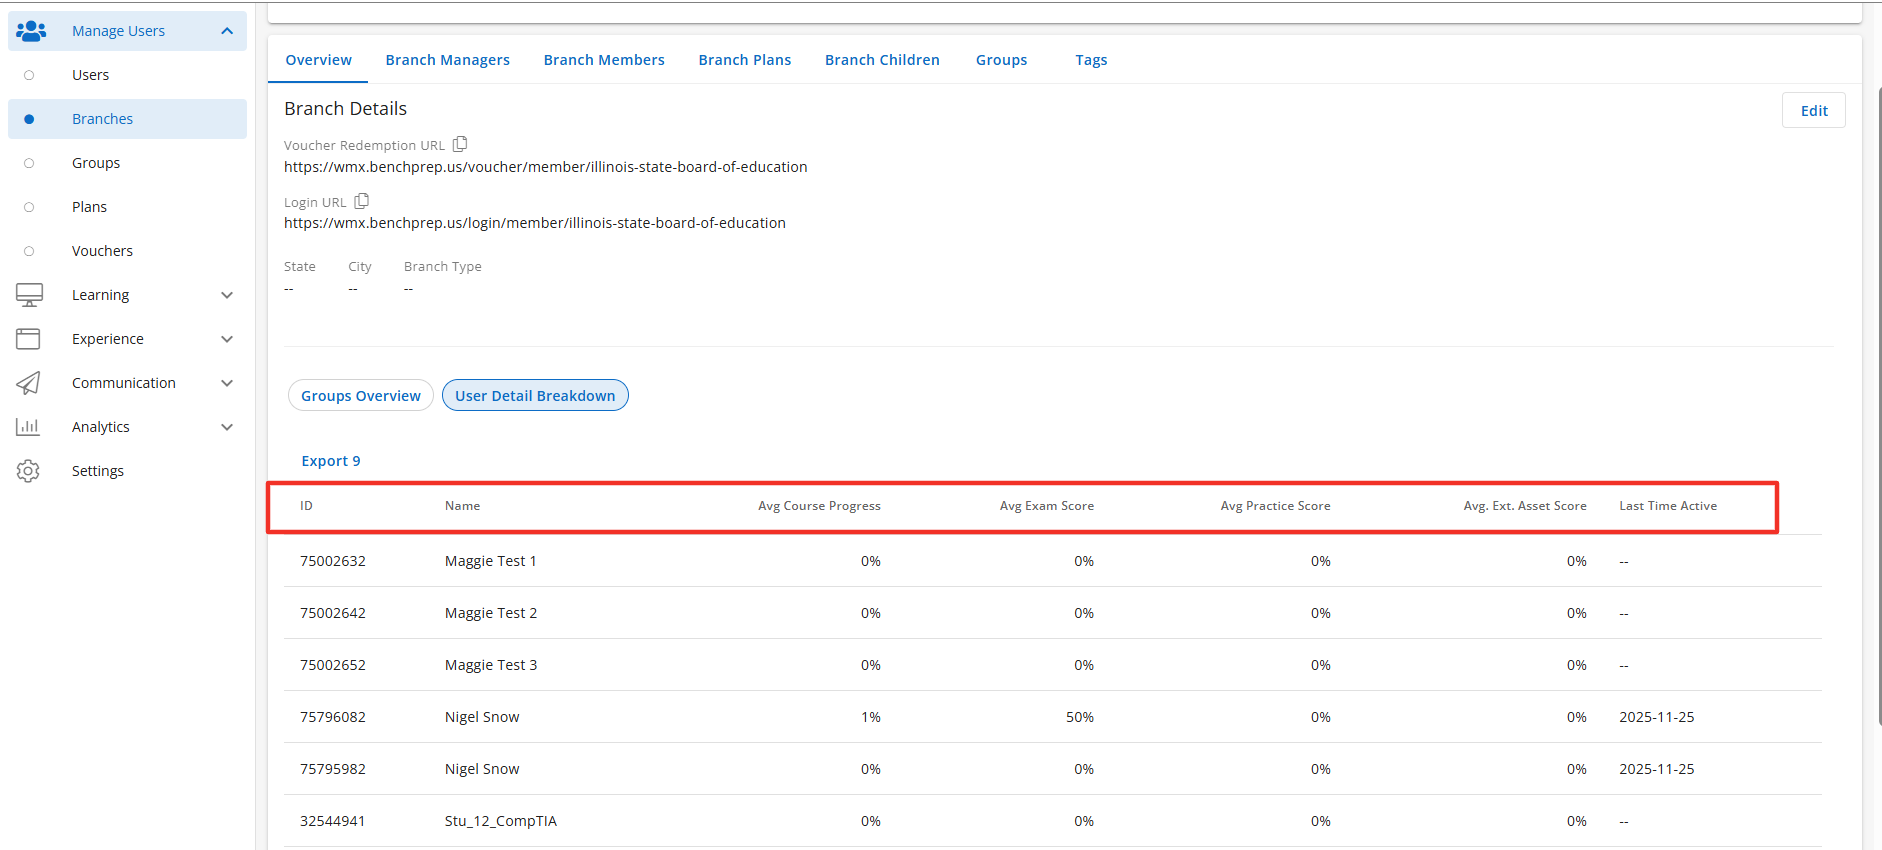
To view more data about the learners in a Branch click on the User Detail Breakdown. The User Detail Breakdown displays data for all learners within the branch when the User Table is enabled.
The User Detail Breakdown page displays the following fields:
- ID - The learners BenchPrep id.
- Name - Name of the learner.
- Avg. Course Progress - Average of all course progress completed by the learner. Course progress is determined by the Study Plan progress within the course. If a Study Plan is not used it is determined by the number of content items completed with the course divided by available content items.
- Avg. Exam Score - Displays the average exam scores (factoring “percent correct” score from exams in started, paused and completed states, including reset exams) for all exams taken by the learner.
- Avg. Practice Score - Averages out the practice scores for a learner in the Branch. The calculation involves taking the sum of practice scores, which includes correct, incomplete, and total answers recorded in practice sessions, and dividing it by the total number of all practice sessions completed by the learner.
- Avg. External Asset Score - Reports an average score from all learner attempts on all SCORM, xAPI, AICC, PDF external assets, including re-attempts/re-launches.
- Last Time Active - Displays the last time a learner completed an activity in the selected group. An activity consists of taking action (i.e. completing, creating, editing, or deleting) for one of the following:
- Confidence levels (lessons, flashcards, or questions)
- Practice questions
- Exams
- Essays
- Bookmarks
- Highlights
- Notes
- Resets (practice questions or exams)
- Continuous learning cycle (if applicable)
The Users Table is a sub-feature of the User Detail Breakdown Tab, to learn more about how to manage this feature please click here.
You also have the ability to Export the data from this page. Simply click on the Export button above the Name column and the CSV will be generated and sent to you via email.
Viewing Group Insights
Users with a custom role with the “Read Groups” and "Read Reports'' permissions will have access to the Group Detail page and the User Detail Breakdown section, scoped to the level the role is assigned at. Users with a Console Admin role will see all users in the tenant.
If you’re a Group Manager, an Instructor of multiple groups, or have custom roles with group-level permissions, you’ll see learner data only for the group scope you have selected. To view learners in another group, simply switch your access context. To learn how to switch context between roles please click here.
To view data for Groups under your purview, follow these steps:
Open Console and select Groups under Manage Users, then select the Group you want to view.

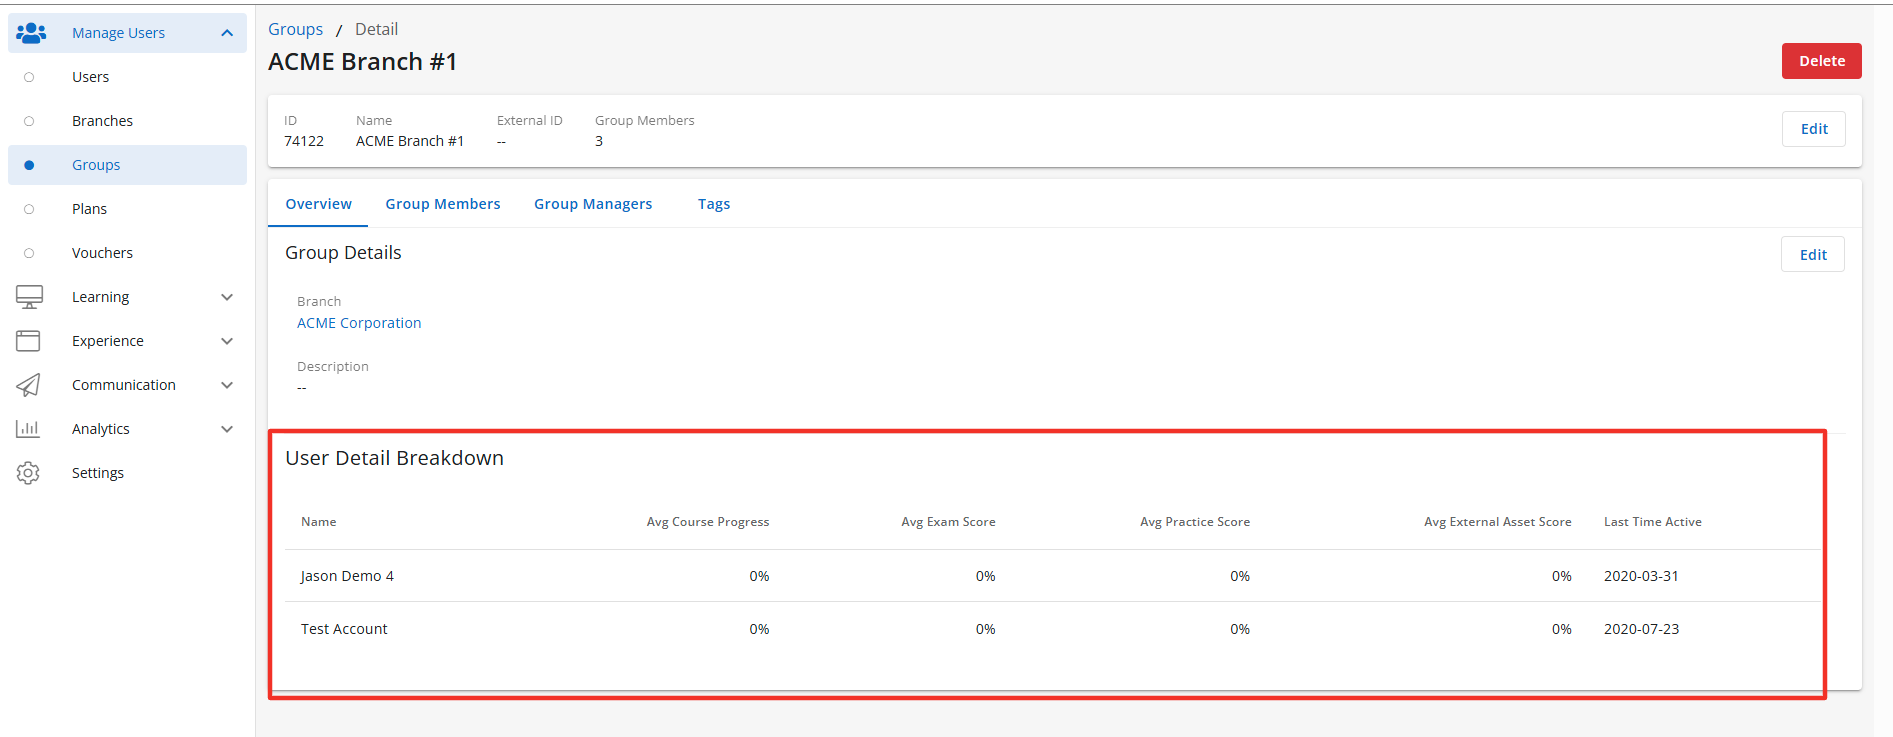
The Group Details page will display information about the selected group. You can filter groups by Group id, External id, name or by Branch. To learn more about the Group Details page click here.
Below the Branch membership the group’s user data will display in the User Details Breakdown section when the Users Table is enabled.
The User Detail Breakdown tab displays the following fields:
- Name - Displays learners name.
- Avg. Course Progress - This column displays average course progress, calculated by averaging progress across all learner’s enrollments within the group. Course progress is determined by the Study Plan progress within the course. If a Study Plan is not used it is determined by the number of content items completed with the course divided by available content items.
- Avg. Exam Score - Displays the average exam scores (factoring “percent correct” score from exams in started, paused and completed states, including reset exams), averaged across all enrollments within the group.
- Avg. Practice Score - Averages the practice scores across all learners in the group. The calculation involves taking the sum of practice scores, which includes correct, incomplete, and total answers recorded in practice sessions, and dividing it by the total number of practice sessions. This average is calculated across all enrollments within the group.
- Avg. External Asset Score - Reports an average score from all learner attempts on SCORM, xAPI, AICC, PDF external assets, including re-attempts/re-launches.
- Last Time Active - Displays the last time a learner completed an activity in the selected Branch. An activity consists of taking action (i.e. completing, creating, editing, or deleting) for one of the following:
- Confidence levels (lessons, flashcards, or questions)
- Practice questions
- Exams
- Essays
- Bookmarks
- Highlights
- Notes
- Resets (practice questions or exams)
- Continuous learning cycle (if applicable)
The Users Table is a sub-feature of the User Detail Breakdown Tab, to learn more about how to manage this feature please click here.
Customizing Tables in BenchPrep Console Analytics
In BenchPrep Console Analytics you can customize what columns are displayed within the tables for User, Branch, and Group Reporting. This allows you the flexibility to only display the data that pertains to your learners. Controlling the columns can be managed in Console within the Feature and Settings. The following tables are able to customized:
- AI Analytics - AI Usage Report Table
- Branch Analytics - Group Table
- Branch Analytics - Users Table
- Course Report - Course Report Table
- Course Report - Curriculums Reports Table
- Course Report - Exam Attempts Table
- Course Report - Exam Report Table
- Course Report - Course Practice Sessions
- Course Report - Practice Report Table
- Course Report - Questions Detail Tags Table
- Course Report - Enrollment Data Points
- Course Report - User Report Table
- Group Analytics - Users Table
- Session Report - Sessions Report Table
- User Analytics - Curriculums Report Table
- User Analytics - Exam Attempts Table
- User Analytics - Exam Report Table
- User Analytics - Learner Reports Table
- User Analytics - Practice Report Table
- User Analytics - Questions Detail Tags Table
- User Analytics - User Practice Sessions
- User Analytics - Study Plan Report Table
In order to toggle certain columns on and off for tables in Analytics follow the steps below:
- Click on Settings in Console.
- Next click on Feature Access and select Analytics.
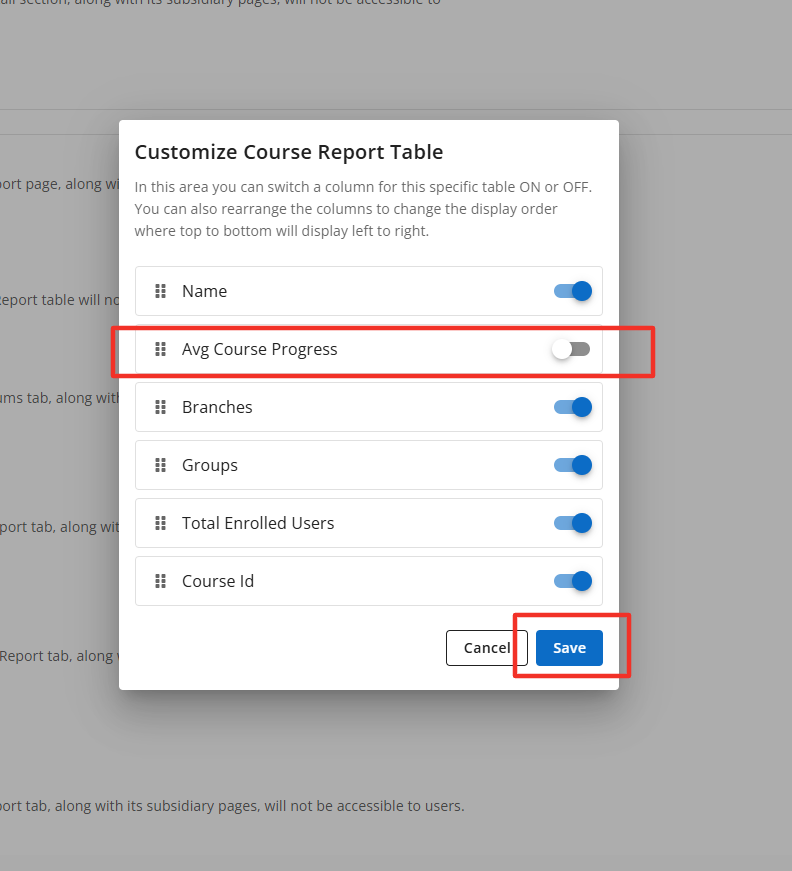
- Locate which table you would like to customize and click on the Customize link next to the feature access.
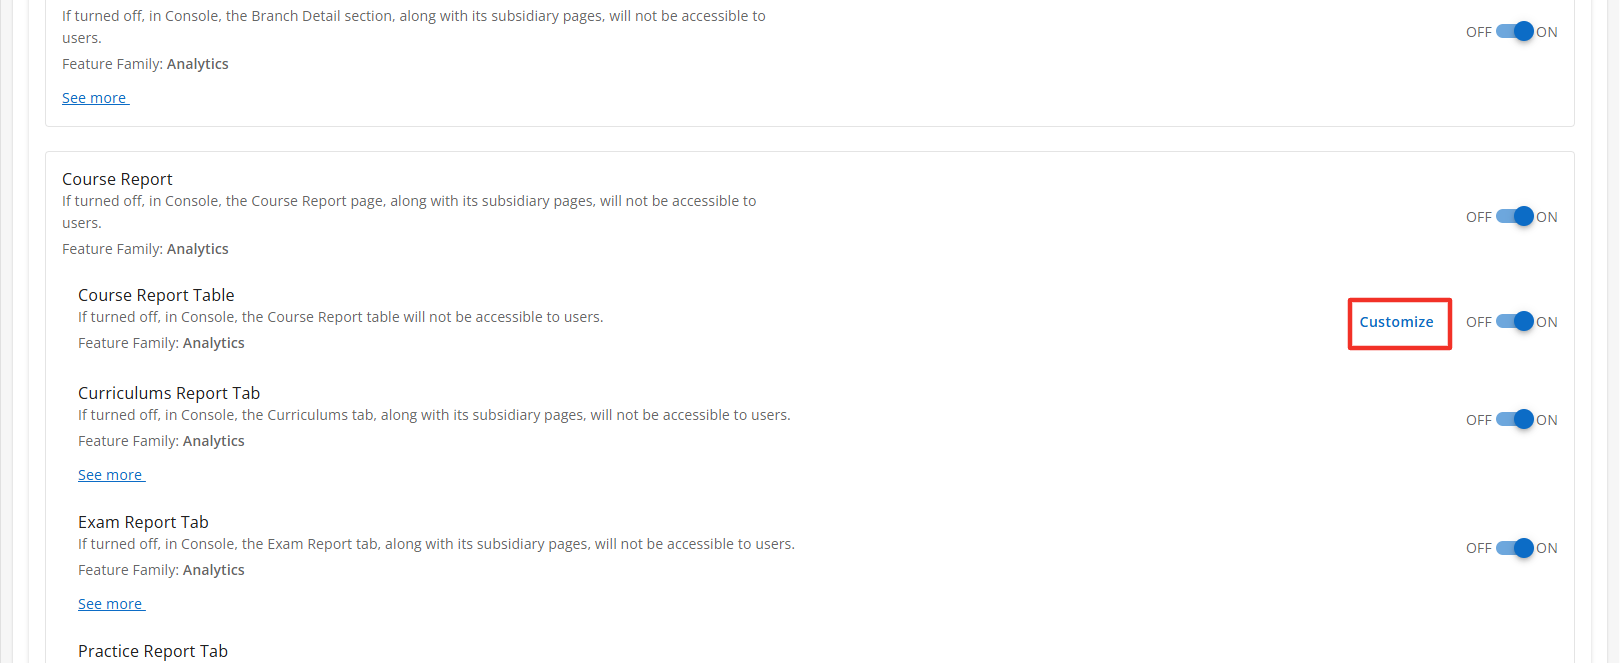
- Once selected a new window will display allowing you to toggle the columns within the table on and off. Once changes have been made click on Save.