
 3032
3032
Please note this article is frequently updated to align with data dashboards improvements, the content you see might not always reflect the current state of this dashboard.
The Branch Dashboard offers an overview of progress and performance data scoped to a specific branch, and even groups within that branch, if applicable. Console admins can use the Branch Dashboard to view data about any branch or group within their tenant. Branch managers who have the “Read reports” permission will be able to view data about their branch and any group in their branch on this page. When viewing data for a parent branch, the Branch Dashboard will not show data about the branch’s child branches - instead, select the child branch directly to view data about its users.
Viewing Branch/Group Dashboard
To view data for users under your purview, follow these steps:
- Open Console and select Analytics, then select Branch Dashboard.
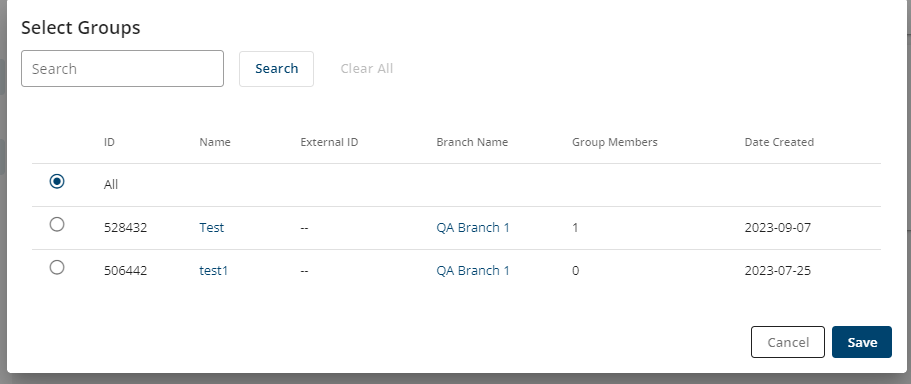
- Select the Select Branch field. This will bring up a pop-up window listing all branches you have the ability to view data for; all branches in your access context.

- Select the branch whose data you want to view (you can select one at a time).
- Select the Save button to close the pop-up.
- If you want to view data for a specific group within the branch, select the Select Group drop-down and choose the group you want to view data for. Select All if you want to view data for all groups within the selected branch.
- Select the Filter button to load the Branch Dashboard.
The Branch/Group Dashboard displays valuable data points below. Keep in mind you can scope the data presented by using the User State filter on the right-hand side. The User State filter displays either Active or Inactive users. Active is displayed when a user's account is active Active is the default state of an account upon creation. The state is not affected by action taken by the user within the platform or license expiration. Inactive is displayed when a user's account has been deactivated. (not affected by any action taken by the user within the platform or license expiration). A user with the “state” of inactive cannot log in. Active is selected by default.
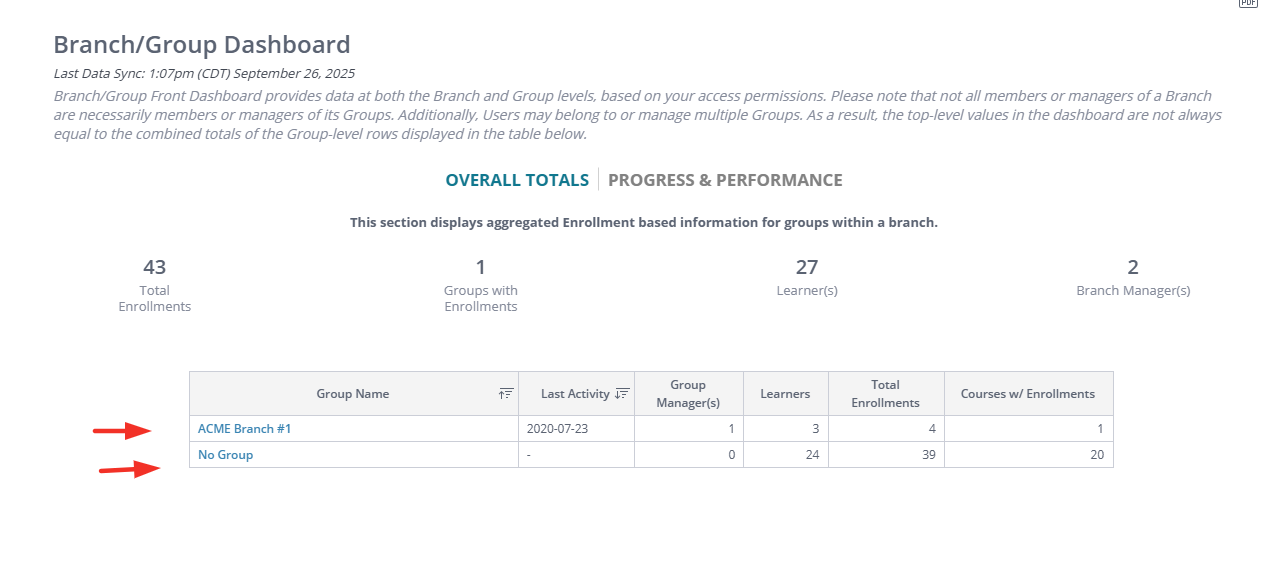
NOTE: Users who are part of a Branch but are not assigned to any group within it will be collectively placed in a No Group section.
The Overall Totals section includes the fields below. The values represent data points at the selected Branch.
- Total Enrollments - total enrollments across the selected branch.
- Groups with Enrollments - the number of groups with active enrollments. Groups with no enrollments are not included.
- Learners(s) - the number of users with no administrative permissions
- Managers(s) - the number of users with administrative permissions within the branch
The Group chart displays high-level data for selected Group(s) within a selected branch. 
The chart displays the following:
- Group Name
- Last Activity - displays the last activity date across all of the users within each group
- Manager(s) - the number of users with administrative permissions within group
- Learner(s) - the number of user with no administrative permissions
- Total Enrollments - the number of enrollments of members of each group
- Courses w/ Enrollments - the number of courses that members of this group are enrolled in
If you manage multiple groups (users with Group Manager role or any other custom role with applicable permissions assigned at GROUP access context) the Branch/Group Dashboard will automatically display all the groups you oversee, eliminating the need to switch access contexts to view data for each group individually.
The dashboard provides a consolidated view of all your managed groups, allowing you to quickly access performance metrics and enrollment data for each group. From this centralized view, you can also navigate into the Group Detail Dashboard of any specific group to review detailed insights, such as average course progress, test scores and other performance metrics scoped to that group.

The Progress & Performance section includes the following:
- Average Course Progress - average course progress by all users in selected branch and groups.
- Average Test Score - displays the average exam scores (factoring “percent correct” score from exams in started, paused and completed states, including reset exams), averaged across all enrollments for selected branch and groups.
- Average Practice Score - averages out the practice scores across all users in the branch/group. The calculation involves taking the sum of practice scores, which includes correct, incomplete, and total answers recorded in practice sessions, and dividing it by the total number of practice sessions. This average is calculated across all enrollments within the branch or group.
- Average External Asset Score - reports an average score from all user attempts on SCORM, xAPI, AICC, PDF external assets, including re-attempts/re-launches.
- Average Lab Score - shows the average lab scores, calculated using only the most recent attempt for each lab.
- Average PBQ Score - (Performance Based Questions) Score - This data point divides the user(s)’ cumulative PBQ score (running average) / total PBQ attempts, including re-attempts/re-launches.
How is each group progressing and performing? - the graph provides a visual representation of the group level average performance and average course progress.
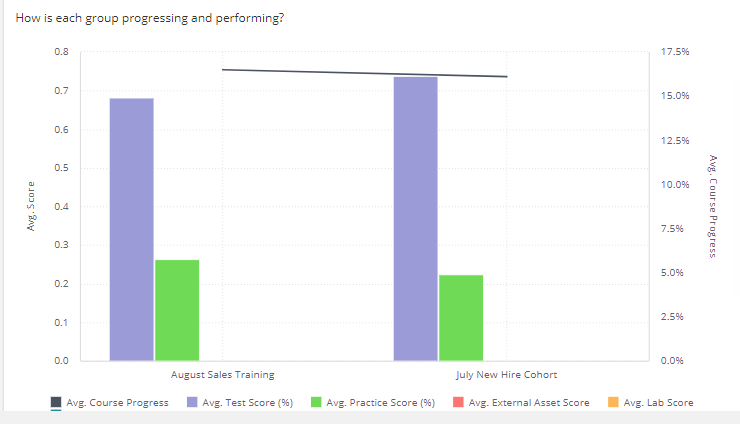
The Group chart displays high-level data for each group within a selected branch.

The chart displays the following fields:
- Group Name
- Last Activity - displays the date a last activity was performed within the group displayed in MM/DD/YY format. An activity consists of taking action (i.e. completing, creating, editing, or deleting) on the following: confidence levels (in practice, flashcards or questions), practice questions , exams, assignments, bookmarks, highlights, notes, resets (practice questions or exams) continues learning cycle (if applicable). A user must complete and activity within their course in order for the active date to update. Displayed in UTC time zone.
- Avg. Course Progress - This column displays average course progress, calculated by averaging progress across all user’s enrollments within the group.
- Avg. Test Score - displays the average exam scores (factoring “percent correct” score from exams in started, paused and completed states, including reset exams), averaged across all enrollments within the group.
- Avg. Practice Score - averages out the practice scores across all users in the group. The calculation involves taking the sum of practice scores, which includes correct, incomplete, and total answers recorded in practice sessions, and dividing it by the total number of practice sessions. This average is calculated across all enrollments within the group.
- Average External Asset Score - reports an average score from all user attempts on SCORM, xAPI, AICC, PDF external assets, including re-attempts/re-launches.
- Average Lab Score - shows the average lab scores, calculated using only the most recent attempt for each lab.
- Average PBQ Score - (Performance Based Questions) Score - This data point divides the user(s)’ cumulative PBQ score (running average) / total PBQ attempts, including re-attempts/re-launches.
Viewing Branch/Group Detail Dashboard
To view in-depth group detail information for a specific group, select the desired group by clicking on the Group Name (in blue) of the Group table to navigate to the Group Detail Dashboard. This dashboard gives an overview of enrollment and performance data scoped to the selected group. Some right-hand side Filters are disabled, since data is scoped to the selected group.
The Group Detail Dashboard displays the following data points below.
- Average Course Progress - average course progress by users in selected group
- Enrolled Users - number of users with enrollments in selected group
- Member Enrollments - the number of enrollments counting each enrollment for each member
- Courses with Enrollments - the number of courses to which users are enrolled in selected group
- Average Test Score - the average exam scores (factoring “percent correct” score from exams in started, paused and completed states and inclusive of reset exams) in selected group
- Average Practice Score - averages out the practice scores across users in selected group. The calculation involves dividing cumulative correct practice scores (based on correct, incomplete, and total answer counts reported from practice session records, inclusive of any practice category resets) by the total number of practice sessions per user per course. The calculation included custom practice sessions.
- Average External Asset Score - reports an average score from all user attempts on SCORM, xAPI, AICC, PDF external assets, including re-attempts/re-launches in selected group.
- Average Lab Score - shows the average lab scores, calculated using only the most recent attempt for each lab in selected group.
- Average PBQ Score - divides the user(s)’ cumulative PBQ score (running average) / total PBQ attempts, including re-attempts/re-launches in selected group.
The Course chart displays group level data across each course that the selected group has enrollments in.

The chart displays the following fields:
- Course Name
- Course Type - Standard or Asset-Based course
- Enrolled Users - number of users with enrollments in the selected group in each course. Note that not all members are/need to be enrolled in each course.
- Avg. Course Progress - average course progress by users in selected group in each course
- Avg. Test Score - the average exam scores (factoring “percent correct” score from exams in started, paused and completed states and inclusive of reset exams) in selected group in each course.
- Avg. Practice Score - averages out the practice scores across users in selected group in each course. The calculation involves dividing cumulative correct practice scores (based on correct, incomplete, and total answer counts reported from practice session records, inclusive of any practice category resets) by the total number of practice sessions per user per course. The calculation includes custom practice sessions.
- Avg. External Asset Score - reports an average score from all user attempts on SCORM, xAPI, AICC, PDF external assets, including re-attempts/re-launches in selected group in each course.
- Average Lab Score - shows the average lab scores, calculated using only the most recent attempt for each lab in selected group in each course.
- Average PBQ Score - divides the user(s)’ cumulative PBQ score (running average) / total PBQ attempts, including re-attempts/re-launches in selected group in each course.
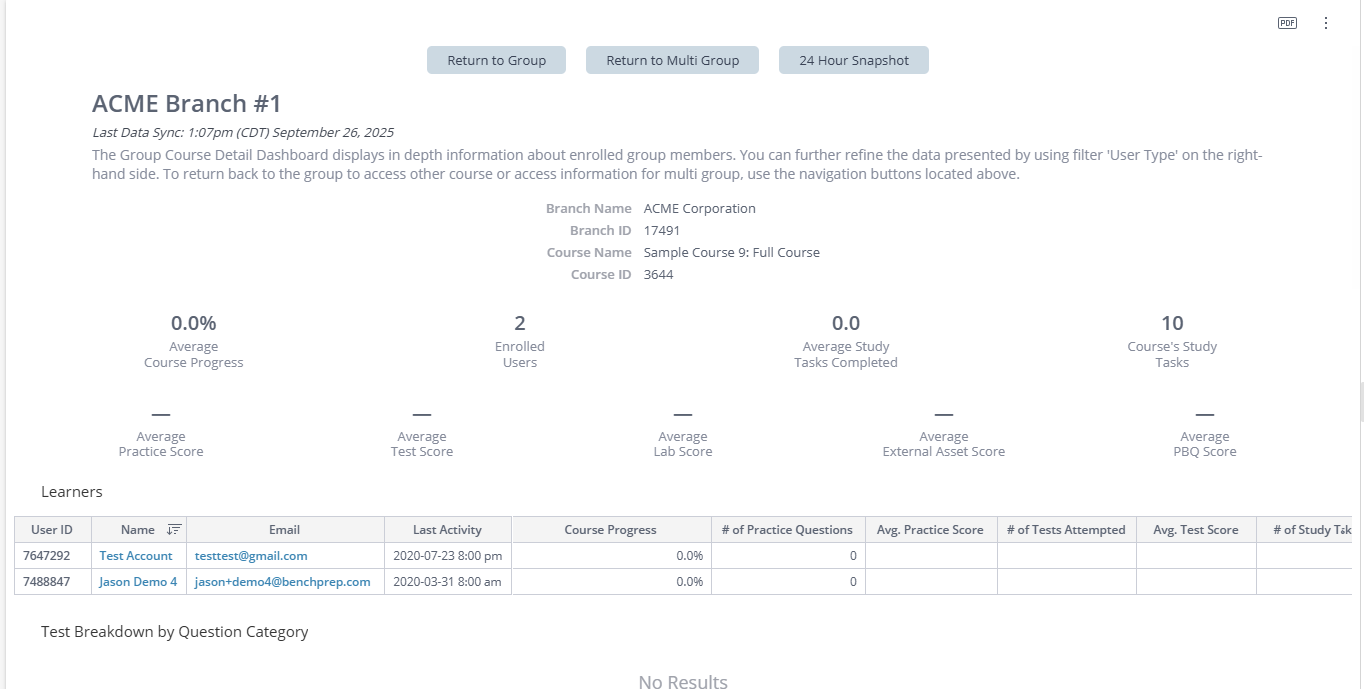
Viewing Group Course Detail Dashboard
To view in-depth group detail information for a specific course, select the desired course by clicking on the Course Name (in blue) of the Course table to navigate to the Group Course Detail Dashboard. This dashboard gives an overview of enrollment and performance data scoped to the selected course. Some right-hand side Filters are disabled, since data is scoped to the selected group. 
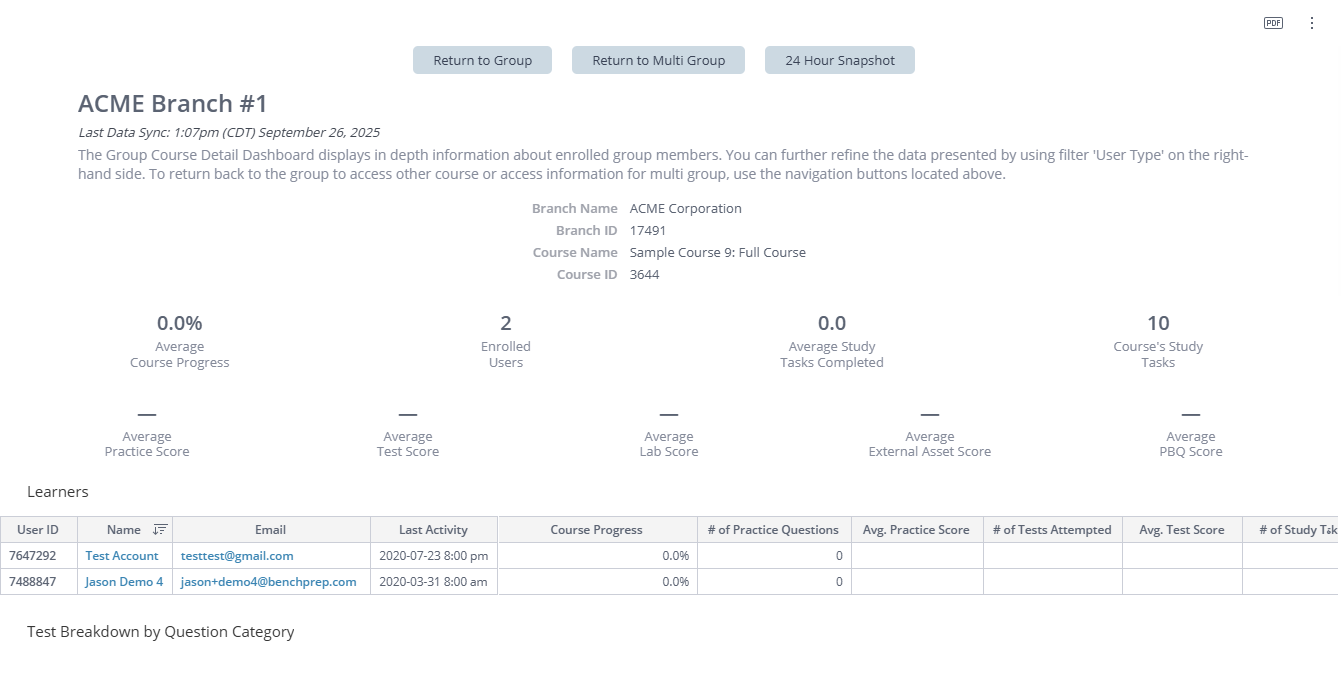
The Group Course Detail Dashboard displays the following data points below. Note, that some right-hand side Filters are disabled, since data is scoped to the selected group and course.
- Branch Name
- Branch ID
- Course Title
- Course ID
- Avg Course Progress - This data point displays average course progress, calculated by averaging progress across all users’ enrollments, in selected course
- Enrolled Users - The number of users from the groups that are enrolled in this course.
- Average Study Tasks Completed - The average number of study tasks completed in this course by group members.
- Course's Study Tasks - The number of study tasks within this course.
- Average Practice Score - Averages out the practice scores across users in selected group and course. The calculation involves dividing cumulative correct practice scores (based on correct, incomplete, and total answer counts reported from practice session records, inclusive of any practice category resets) by the total number of practice sessions. The calculation included custom practice sessions.
- Average Test Score - This data point reflects the average test scores (factoring “percent correct” score from exams in started, paused and completed states and inclusive of reset exams), providing you with an aggregate view of overall performance in exams in selected group and course.
- Average Lab Score - This widget reflects the average results of lab scores. This calculation only includes lab results that have a score in selected group and course.
- Average External Asset Score - reports an average score from all user attempts on SCORM, xAPI, AICC, PDF external assets, including re-attempts/re-launches in selected group and course.
- Average PBQ Score - Divides the user(s)’ cumulative PBQ score (running average) / total PBQ attempts, including re-attempts/re-launches in selected group in each course.
Users with the required permissions to view the Analytics Dashboard will also have access to the 24 hour snapshot within the Group course detail page. The 24 hour snapshot includes detailed data on test attempts and activity logs—providing a focused view of learner engagement and performance over the last 24 hours.
To access the 24 hour snapshot within the user’s dashboard follow these short steps:
- Select the user you would like to view for the 24 hour snapshot.
- Once you have selected the user choose which course you would like to view for the user.
- Once you have selected the course click on the 24 hour snapshot to view the user’s data.
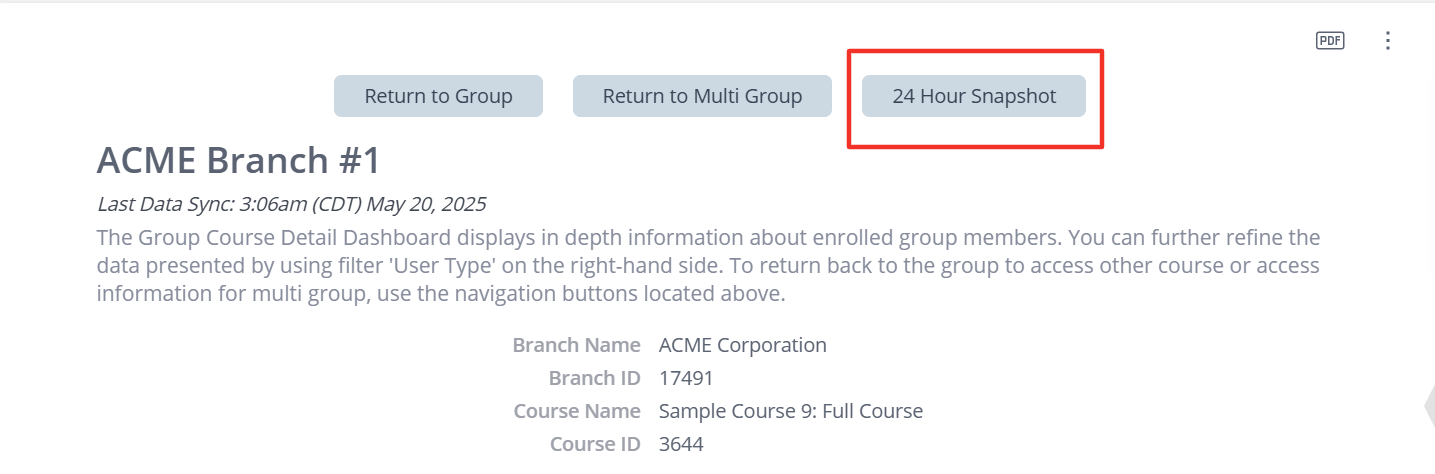
The table for the Group 24 hour Snapshot displays the following information:
- User ID
- Name
- Last Activity (Last time the user clicked on an activity)
- Course Progress
- # of Practice Questions
- # of Test attempts
- # of Study Task Completed
Review user specific course performance based on the options below.
The Learners section displays user data within the selected group and course.
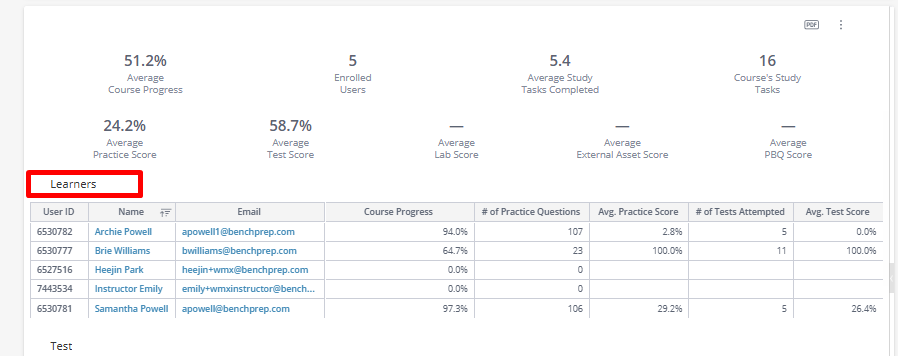
The chart includes:
- User ID
- Name
- Last Activity
- Course Progress
- # of Practice Questions - displays the number of questions attempted.
- Avg. Practice Score - this data point divides total correct answers on practice questions by the total answers submitted on practice questions (based on correct, incomplete, and total answer counts reported from practice session records, inclusive of any practice category resets) by the total number of practice sessions for this user in this course. The calculation includes custom practice sessions.
- # of Tests Attempted
- Avg. Test Score - displays the average exam scores (factoring “percent correct” score from exams in started, paused and completed states, inclusive of reset exams) for this user in this course.
- # of Study Tasks Completed - displays number of completed study tasks within the course.
- Average Lab Score - shows the average lab scores, calculated using only the most recent attempt for each lab.
- Average External Asset Score - This data point reports an average score from all user attempts on SCORM, xAPI, AICC, PDF external assets, including re-attempts/re-launches.
- Average PBQ (Performance Based Questions) Score - This data point divides the user(s)’ cumulative PBQ score (running average) / total PBQ attempts, including re-attempts/re-launches.
- Total Time Spent (in minutes) - Total time spent in a study session refers to the recorded period during which a learner is actively engaged with our platform. A session begins when the learner starts an activity—such as viewing content, completing tasks, or interacting with learning materials—and ends when there has been no interaction with the platform for 15 consecutive minutes.
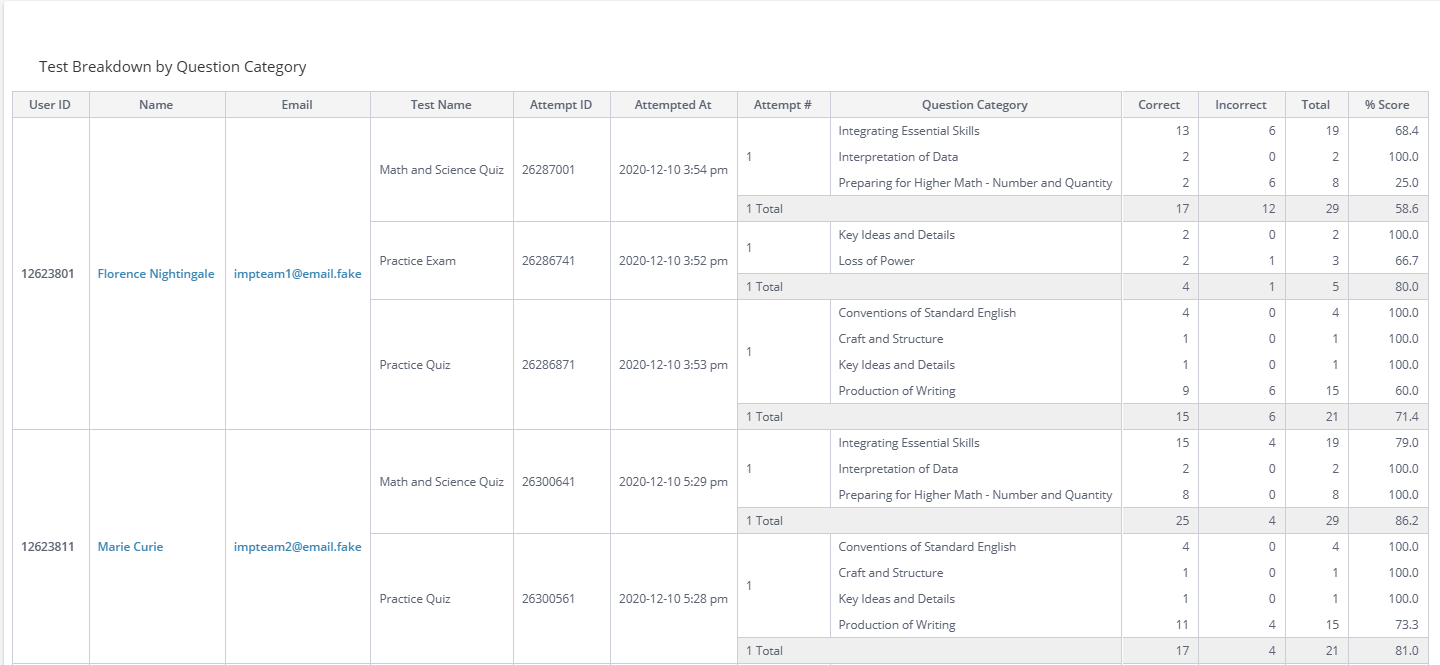
Test Breakdown by Question Category table displays the following information:
- User ID
- Name
- Test Name
- Attempt ID
- Attempted At
- Attempt #
- Question Category
- # of Questions Correct per category
- # of Questions Incorrect per category
- Total # if questions Answered per category
- % Score per category
- Total # of questions correct, # of questions incorrect, # of questions taken, and total combined score of all categories.
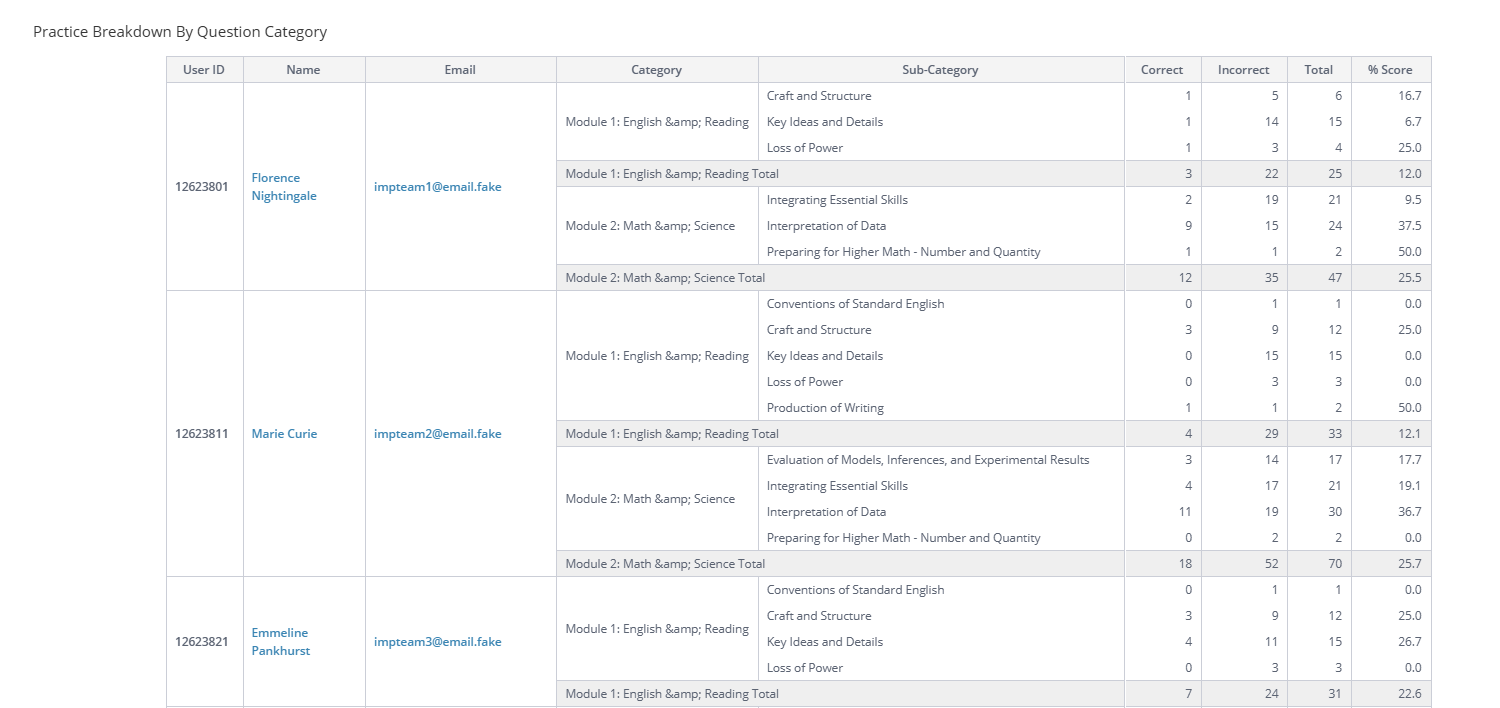
Practice Breakdown By Question Category table displays the following information:
- User ID
- Name
- Question Category
- Question Sub-Category
- # of Questions Correct per sub-category
- # of Questions Incorrect per sub-category
- Total # if questions Answered per sub-category
- % Score per sub-category
- Total # of questions correct for category, # of questions incorrect category, # of questions taken in category, and total combined score of all sub-categories.
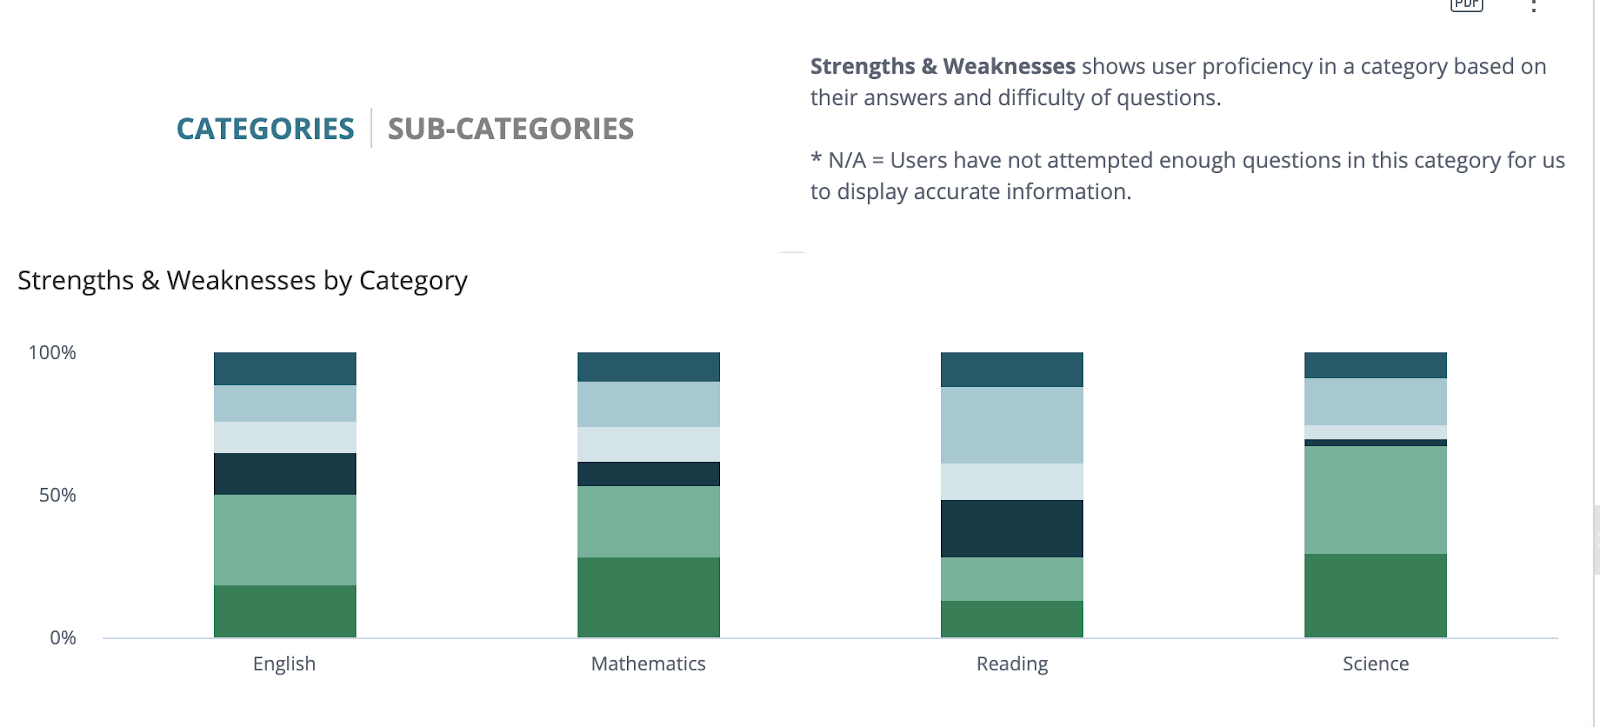
The Categories and Sub-Categories sections of the Group Course Detail Dashboard provide additional course specific data on Strengths & Weaknesses. Strengths & Weaknesses shows user proficiency in a category based on their answers and difficulty of questions.
* N/A = Users have not attempted enough questions in this category to display accurate information.
Categories tab displays the following:
- Shows the users' proficiency by category based on their answers and difficulty of questions within selected course. Proficiency levels include: Beginner, Basic, Intermediate, Proficient, Advanced, Expert or N/A).
Sub-Categories tab displays the following:
- Shows the users' proficiency levels by each subcategory based on the answers and question difficulty within selected course. Proficiency levels include: Beginner, Basic, Intermediate, Proficient, Advanced, Expert or N/A).
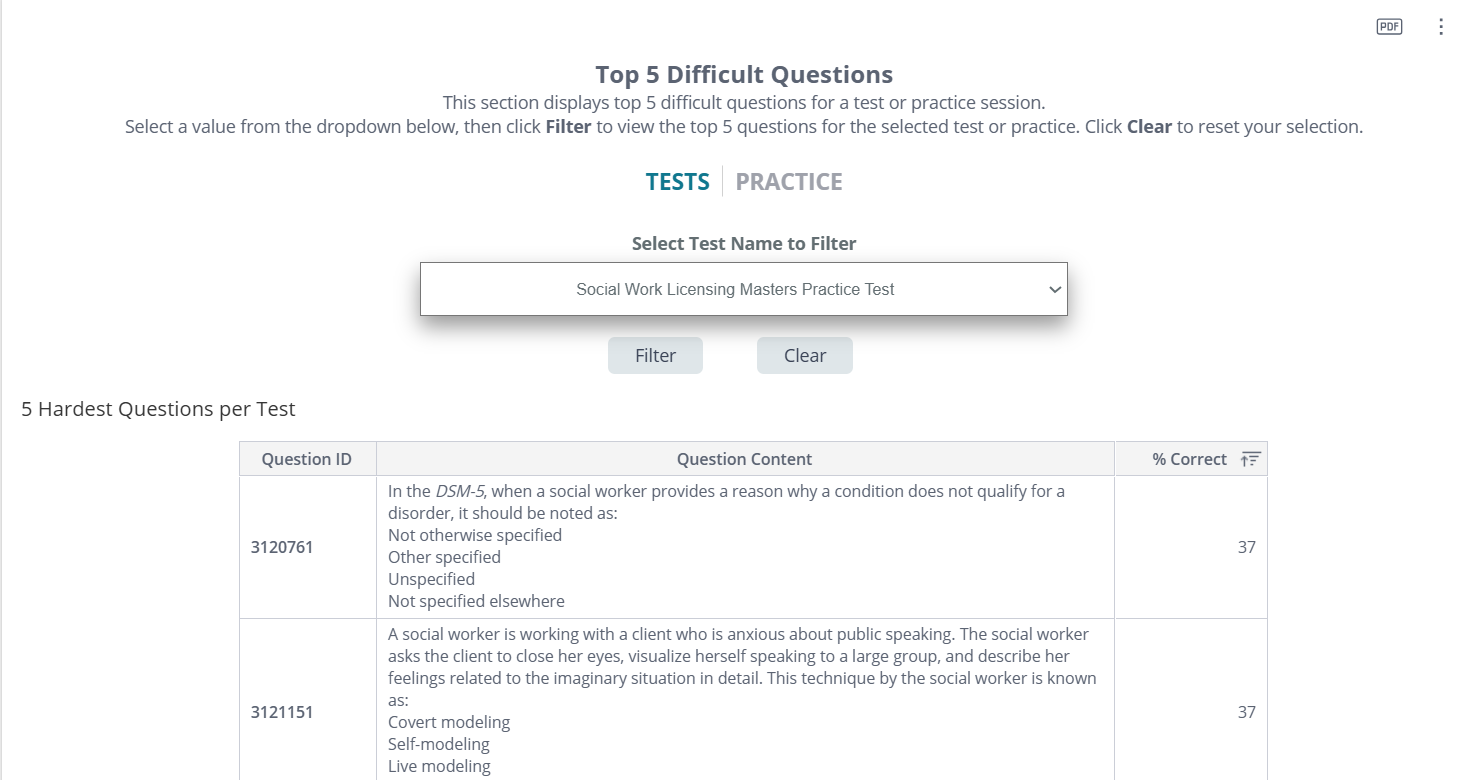
The Top 5 Difficult Questions chart on the group course detail page displays the 5 most difficult questions user completed within a test or practice session. You can filter the chart by Practice or Test. You can also filter by test or questions category. The chart displays the Question id, Question Content, and Correct %.
Curriculums chart displays data for each curriculum providing a comprehensive overview of performance for a selected group. If there is not a curriculum associated with the course this chart will not display data.
The Curriculums chart displays the following:
- Curriculum Name
- # of tasks in the Curriculum
- # of tasks completed
- % of tasks completed
- Practice Questions % Score
- Test % score
- Date user started the curriculum
- Date user completed the curriculum
- Last Active


