3339
3339
When creating a new course in BluePrint, fill out the description section with a brief description of the course, which will be visible to learners in the Learning Hub once the course is live. Use the WYSIWYG editor or your own HTML to format your text:

For an existing course, you can modify the description field by navigating to your course in BluePrint, clicking on the Edit Course button, and updating the Description field.

From this page, you can also update the image you would like to use that will appear in Learning Hub instead of using the default images offered:

NOTE: Only JPG and PNG images are accepted. For best results, upload an image with dimensions 840 x 432 px. BenchPrep only uses one image to support the “View Details” and the “Card View” background images. The “View Details” image is the image that displays in the Learning Hub dashboard above the course title. The “Card View” is the background image that is displayed after clicking on View Details. Slight pixelation may occur when uploading an image. For best results, you may need to try multiple images.
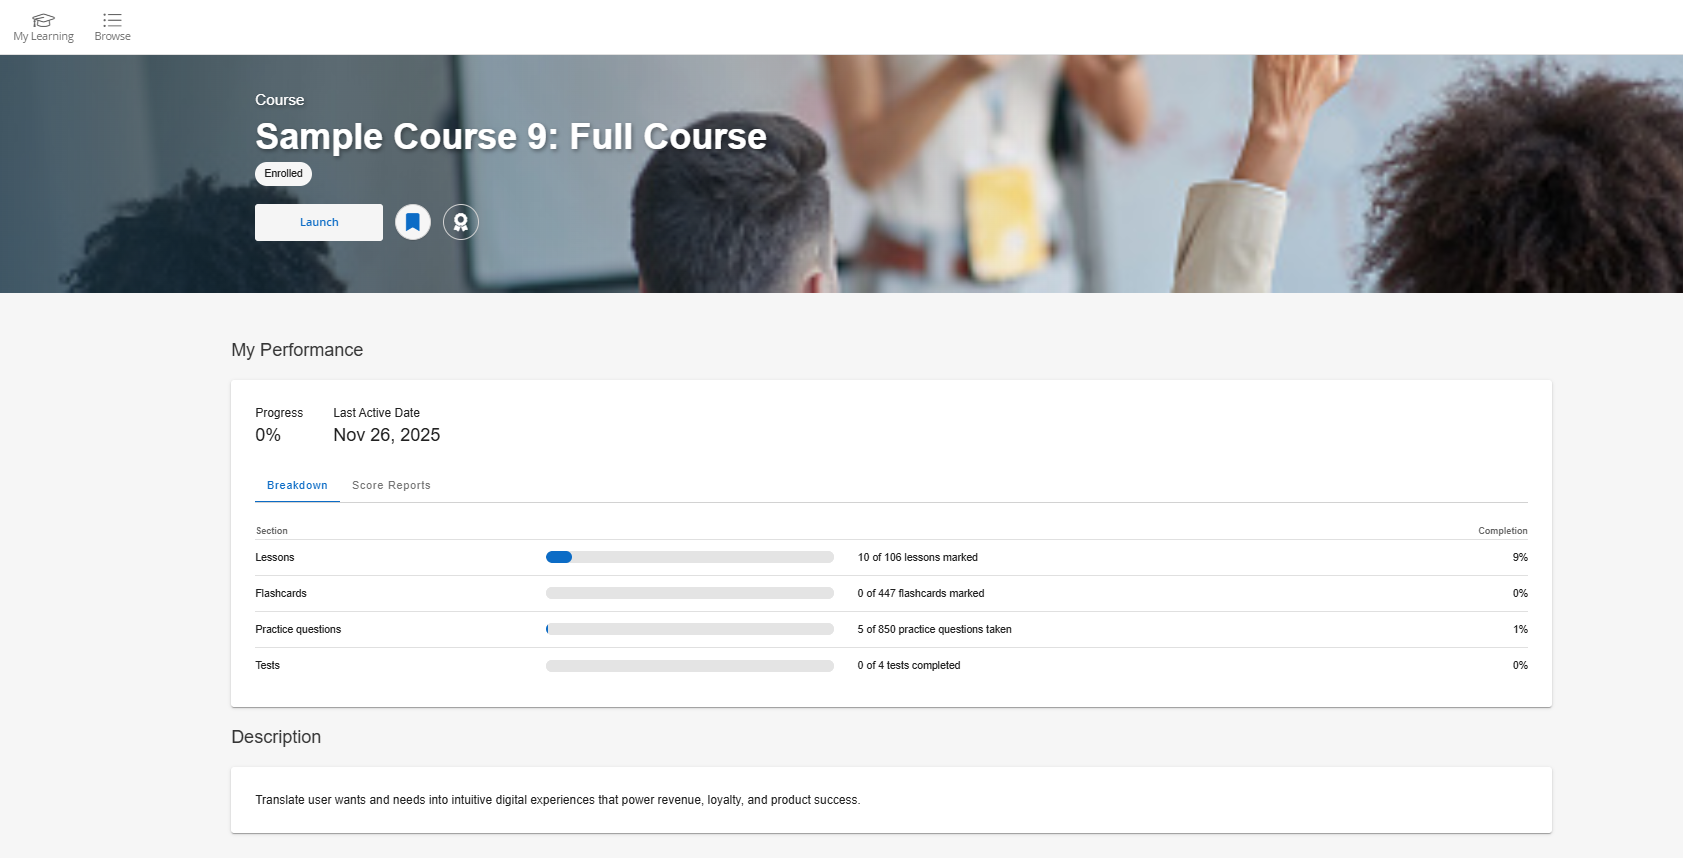
Learners with Learning Hub access will see the course image and description after saving your changes.

When the learner clicks on View Details, the summary page will populate the description field and display the learner's association to that course (i.e. enrolled, study, launch, or buy).
The Breakdown tab displays details about the learner's progress and activity in the course.
The Score Reports tab displays Exam Report and Practice Report sections with additional data:
- Exam Report - appears when "Previous Exam Score Reports" feature access is on. It provides a detailed view of exam activity, showing information such as exam name, questions taken, percent correct, time spent, attempt date, and exam state. For exams that support scaled scoring, the report also includes your scaled score and percentile rank.
- Practice Report - appears when "Display Previous Practice Sessions Reports" feature access is on. It shows practice activity by category, including completion, percent correct, and average answer times. It displays data for both category and subcategory resets to support tracking progress over time.