143
143
AI Reporting
The AI Report provides a comprehensive overview of how the AI assistant is being utilized and received. This report tracks key engagement and feedback metrics—including day-by-day activity, number of unique users, total conversations, message volume, and user sentiment through likes and dislikes—enabling monitoring of performance, identification of trends, and data-driven improvements to the AI experience. This reporting is only applicable for customers who are currently using our AI Assistant. To learn more about our AI Assistant and how to enable this click here.
In order to view the Course Reports tab you must have a custom role with “Read AI Analytics” and "Read Content Package” permissions. Users with a Console Admin role will see all courses in a tenant.
If you manage multiple branches and groups (users with Branch Manager, Group Manager role or any other custom role with applicable permissions assigned at Branch and Group access context) the AI Report dashboard will only allow you to filter to courses within your access.
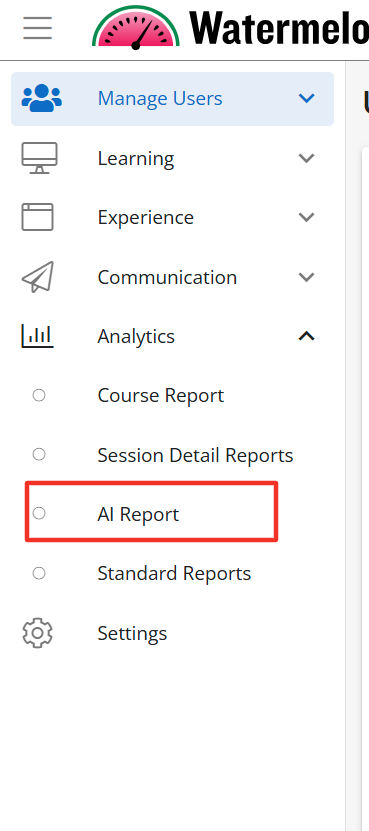
To view the AI Report please click on Analytics and then select AI Reports.
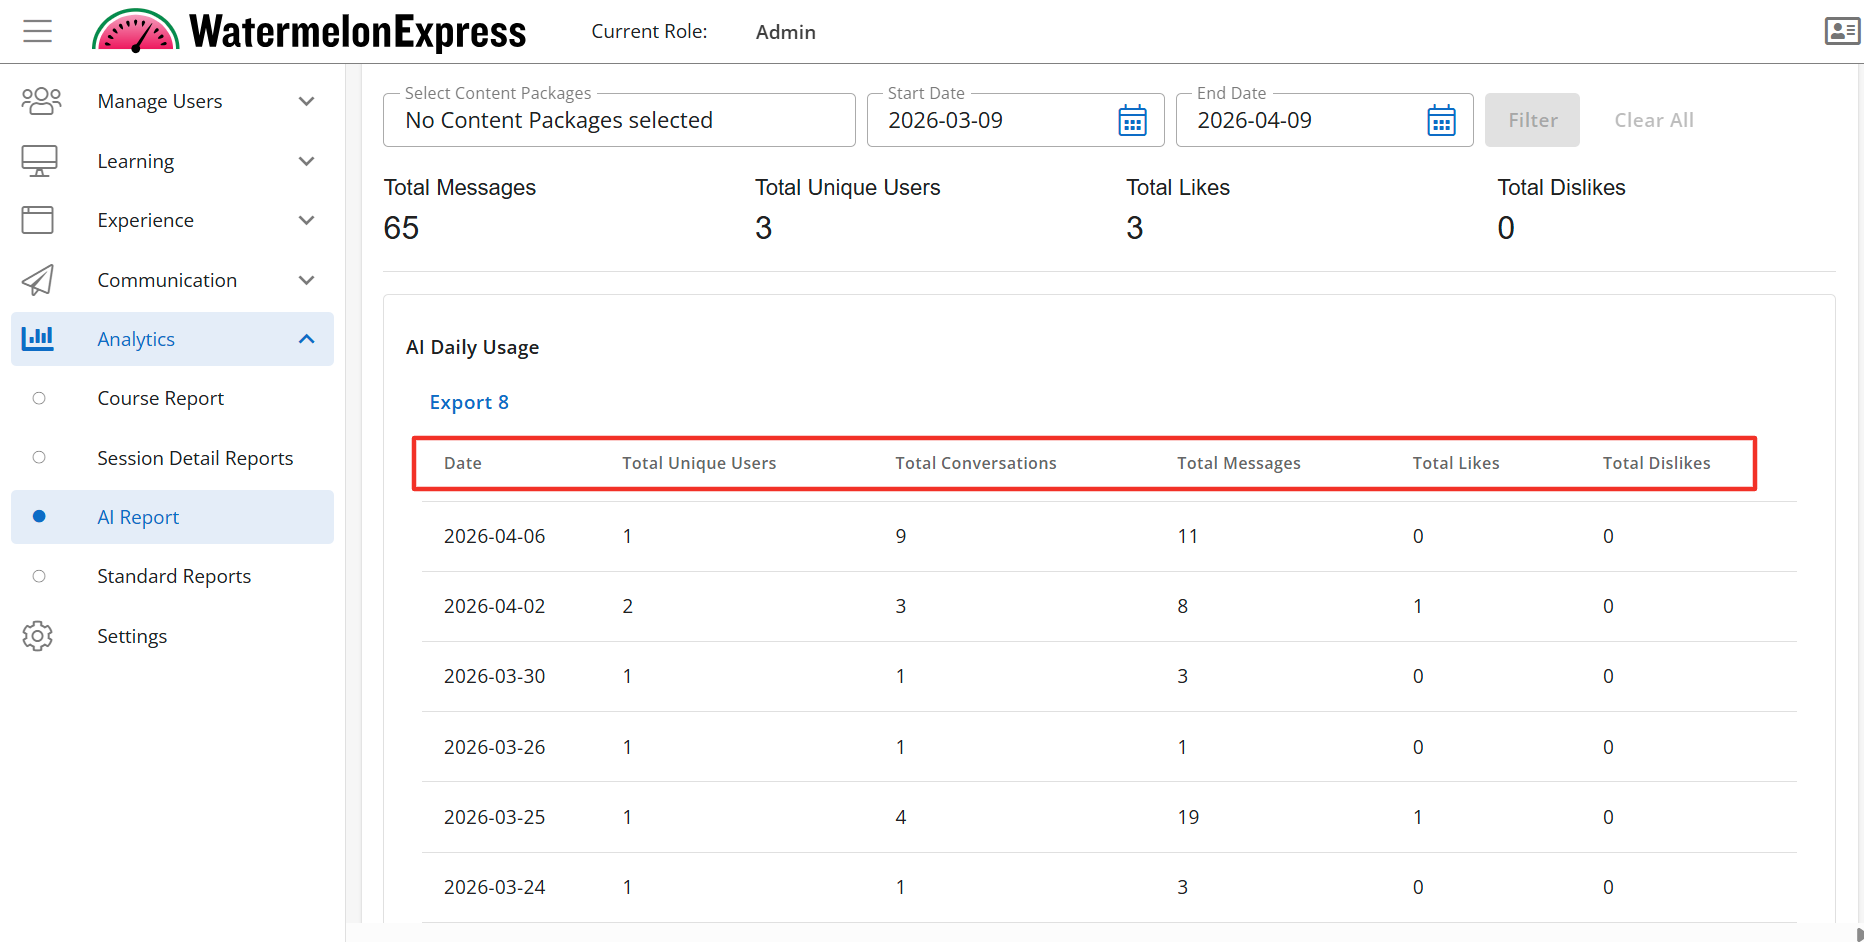
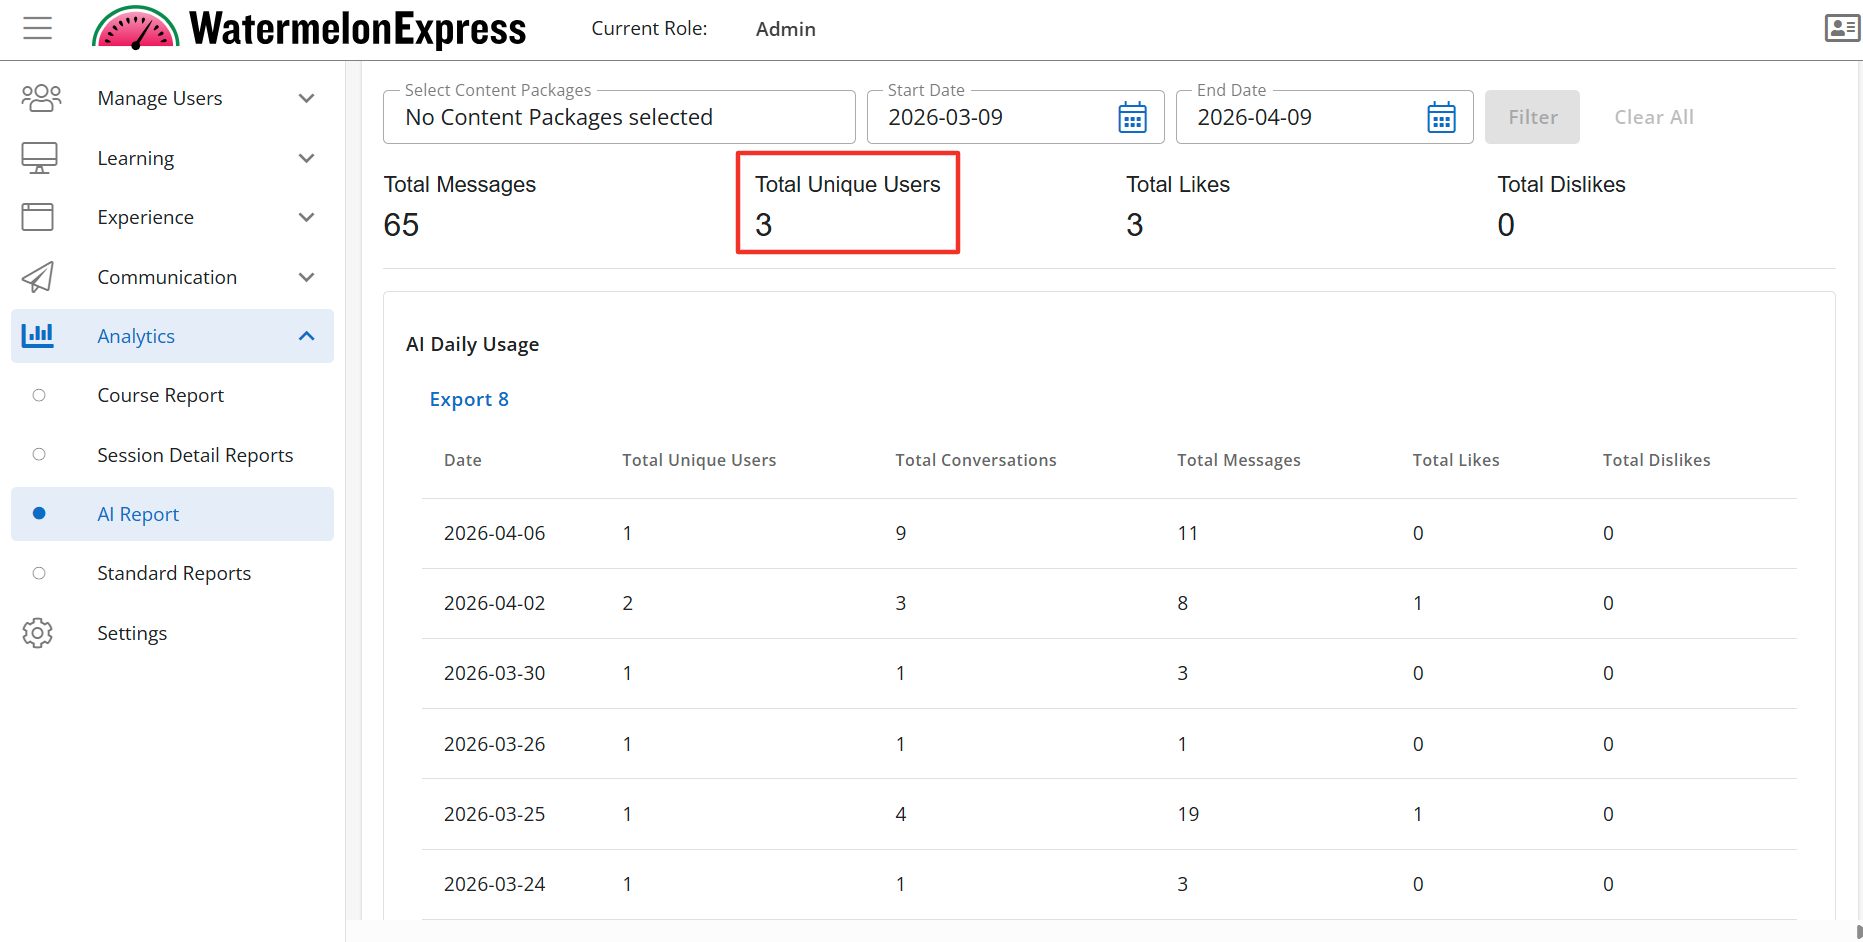
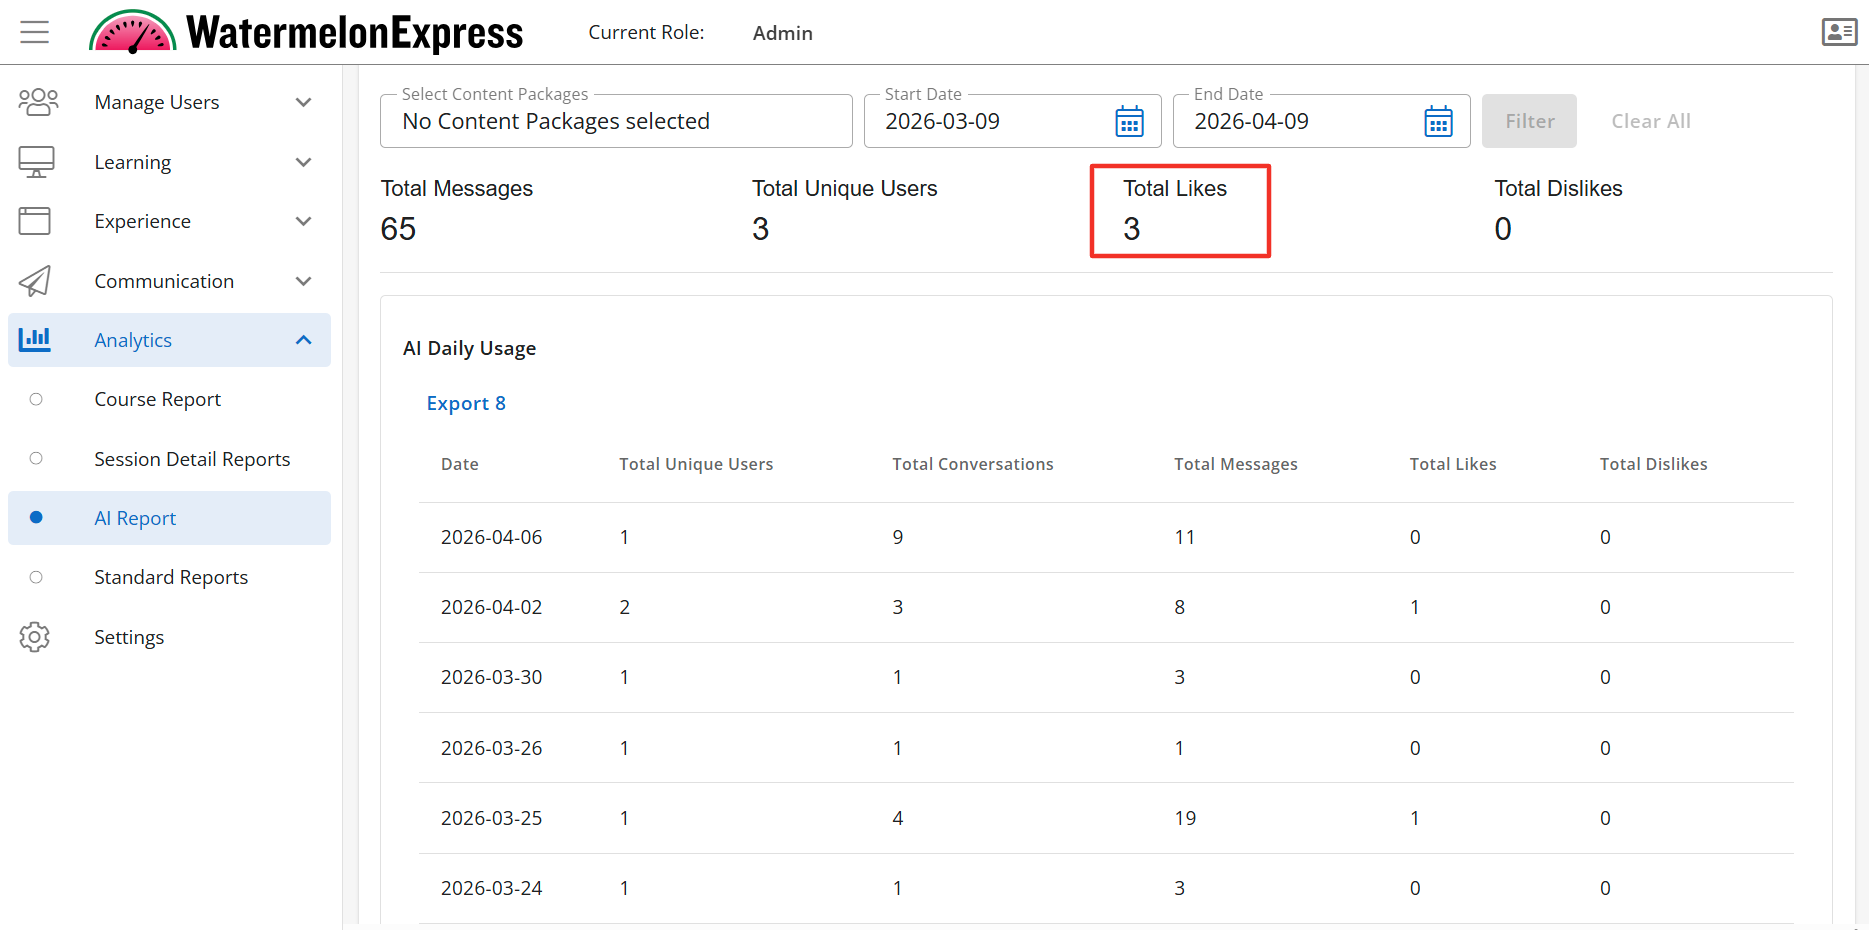
The AI Report displays the AI Daily Usage table when enabled. The AI Daily Usage table can be filtered by content package, start date, and end date. In order to populate the table you must filter the search. By default no data is populated for the table. The AI Daily Usage table displays the following fields:
- Date
- Total Unique Users
- Total Conversations
- Total Messages
- Total Likes
- Total Dislikes
The AI Daily Usage Table is a sub-feature of the AI Report tab. To learn more about how to manage this sub-feature click here.
If enabled multiple widgets provide overall data pertaining to the usage of the AI Assistant in your selected date range and course. Each of these widgets are their own Feature Access and are listed below.
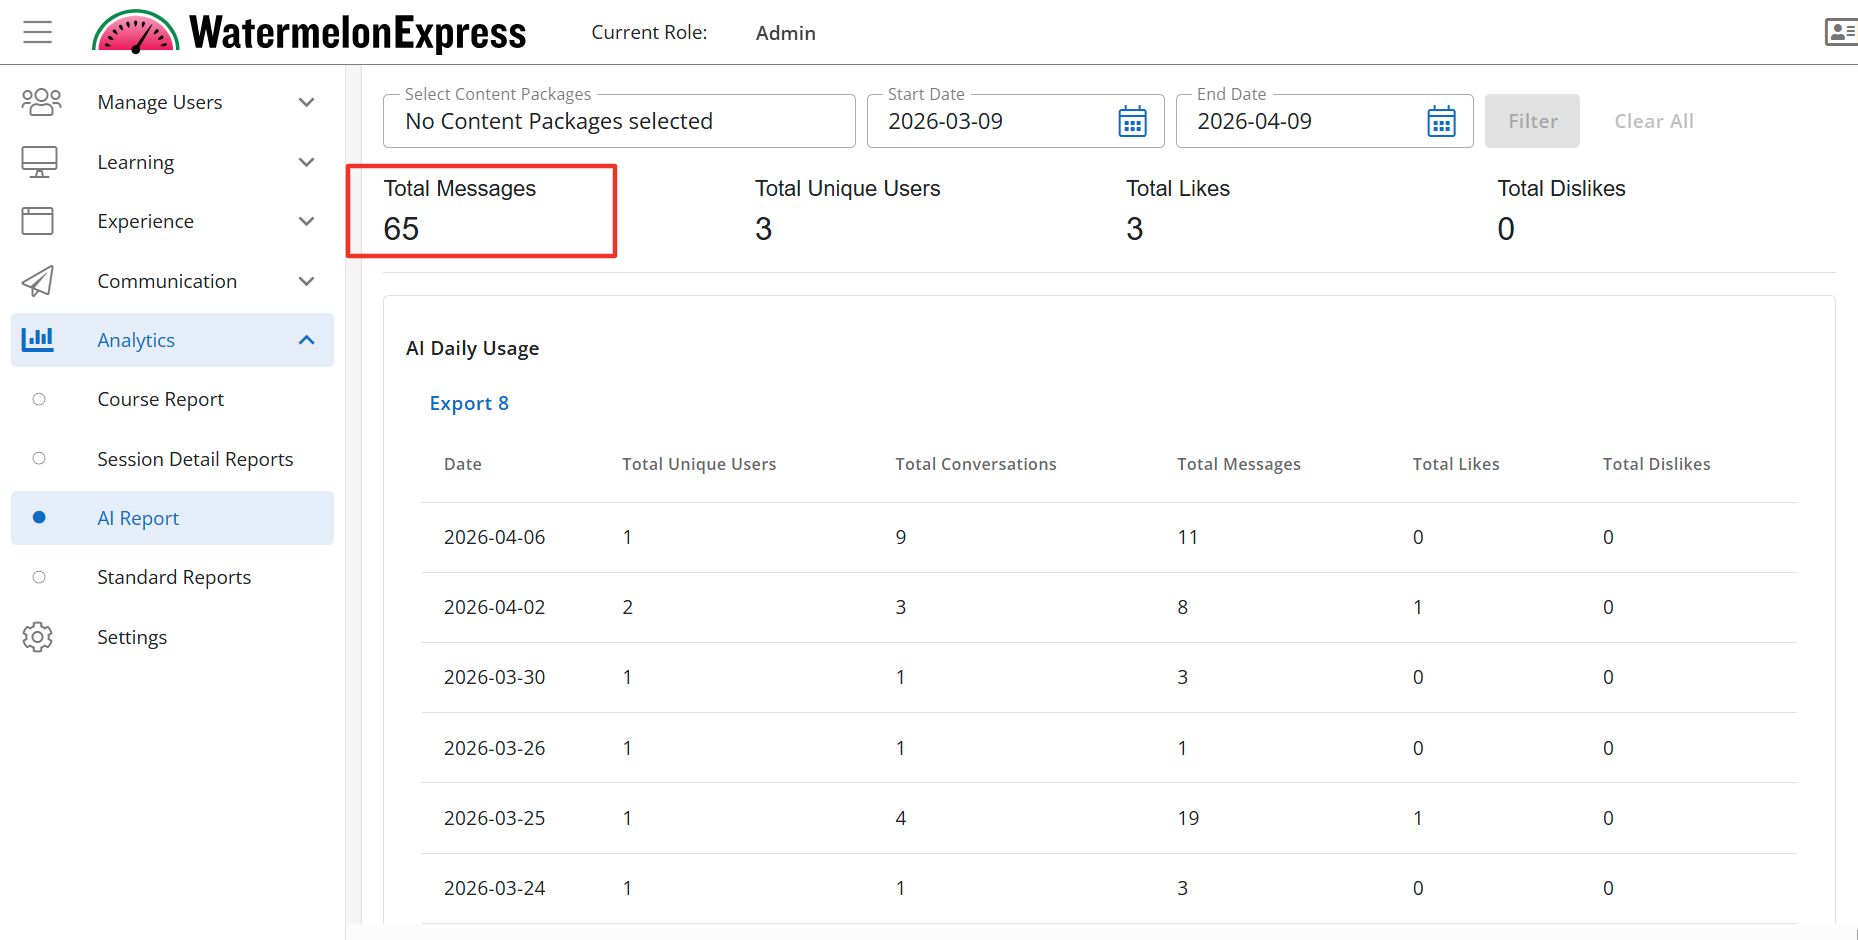
The AI Usage Report - Total Messages Data Point is a sub-feature of the AI Report tab. To learn more about how to manage this sub-feature click here.
The AI Usage Report - Total Messages Data Point will display the Total Messages widget. The Total Messages is the total number of messages learners sent while using the AI Assistant. The Total Messages displays above the AI Daily Usage table if enabled.
The AI Usage Report - Total Unique Users Data Point is a sub-feature of the AI Report tab. To learn more about how to manage this sub-feature click here.
The AI Usage Report - Total Unique Users Data Point will display the Total Unique Users widget. The Total Unique Users is the total number of different/unique learners that engaged with the AI Assistant. The Total Unique Users displays above the AI Daily Usage table if enabled.
The AI Usage Report - Total Likes Data Point is a sub-feature of the AI Report tab. To learn more about how to manage this sub-feature click here.
The AI Usage Report - Total Likes Data Point will display the Total Likes widget. The Total Likes is the total number of likes a response received while a learner was engaged with the AI Assistant. The Total Likes displays above the AI Daily Usage table if enabled.
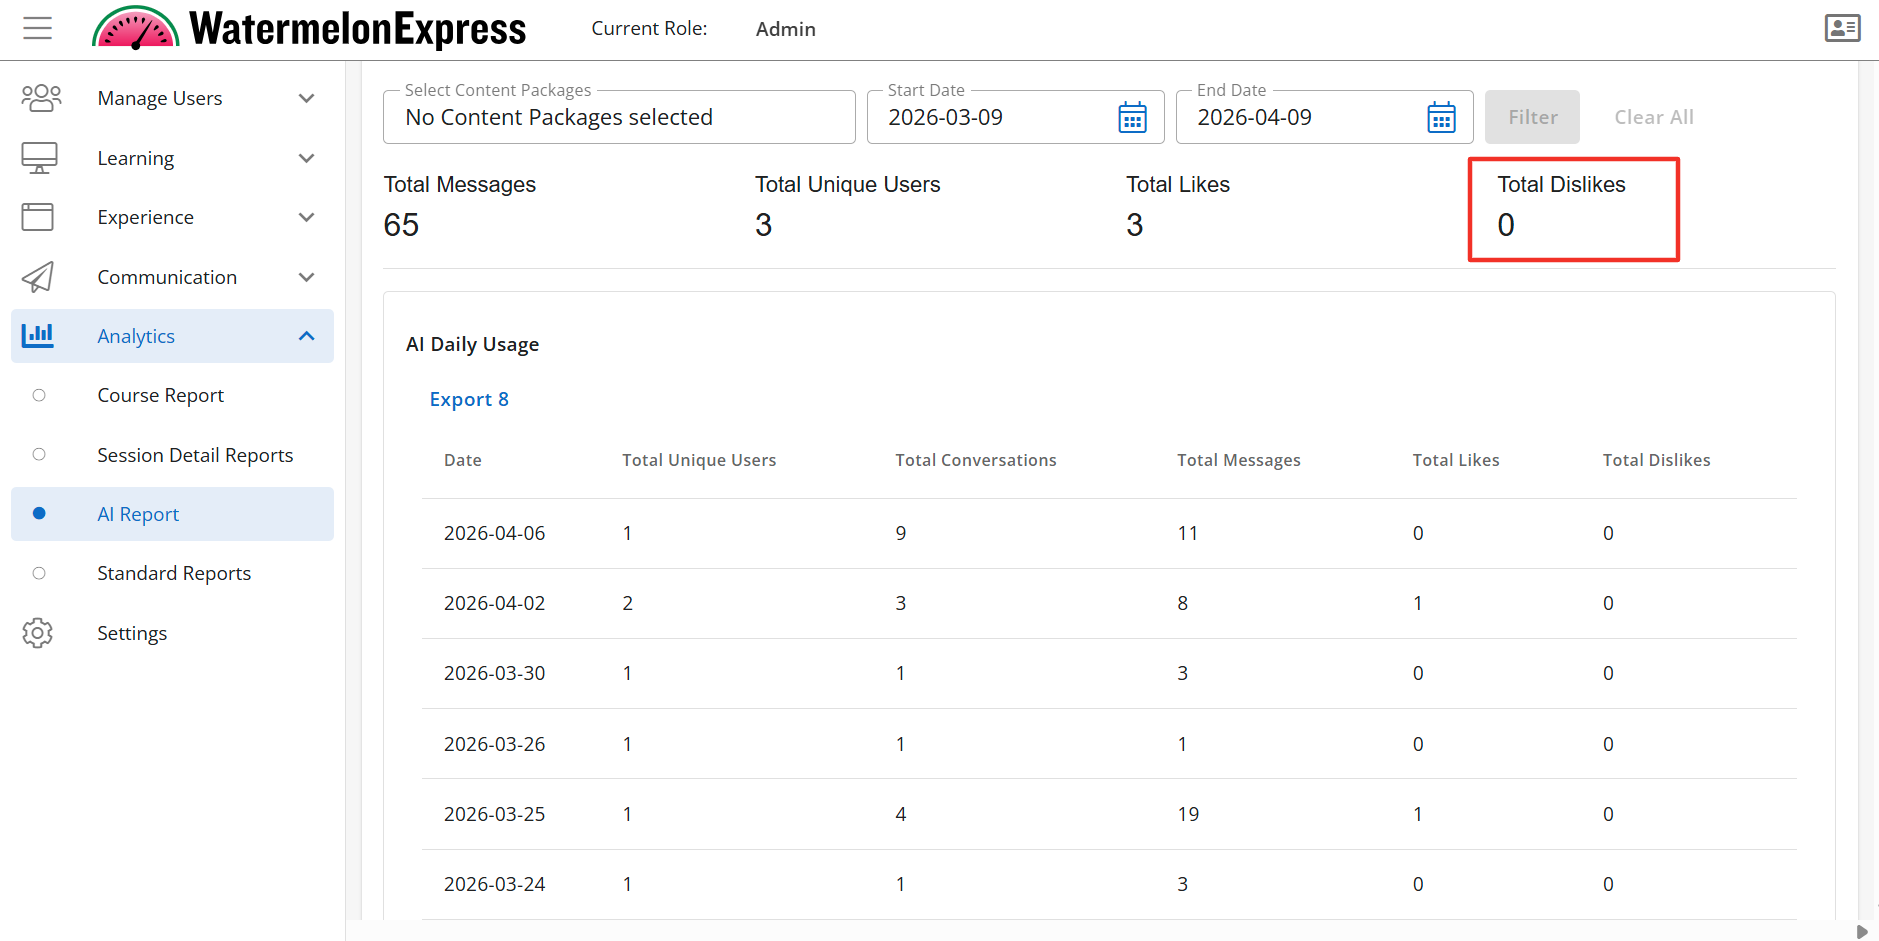
The AI Usage Report - Total Dislikes Data Point is a sub-feature of the AI Report tab. To learn more about how to manage this sub-feature click here.
The AI Usage Report - Total Dislikes Data Point will display the Total Dislikes widget. The Total Dislikes is the total number of likes a response received while a learner was engaged with the AI Assistant. The Total Dislikes displays above the AI Daily Usage table if enabled.