
 607
607
Please note this article is frequently updated to align with data dashboards improvements, the content you see might not always reflect the current state of this dashboard.
The Psychometric Dashboard presents timely data pertaining to exam and item-level engagement in aggregate, and at the course level, and scoped to the level of permission for your account.
The dashboard is accessible via Console to admin users and users with the following permissions assigned:
- read:psychometric_dashboard permission
- access console permission (checked by default)
- read:roles permission (checked by default)
- read:permissions permission (checked by default)
All four permissions must be assigned to the user's role to access the Psychometric Dashboard.
Click here to learn how to create a custom Console role.
Viewing Psychometric Dashboard Data
To view Psychometric Dashboard follow these steps:
- Open Console, and select Analytics, then select Psychometric Dashboard

- The page will show all of the available reports within the specific dashboard. Beneath a report title is a brief description of each report to provide additional information on the specific report:

The Exam Level Statistics chart represents exam specific aggregated data. Only completed exams are included in the analysis. Reset exam results are not included in the calculations.
The table includes:
- Course
- Exam Name
- Exams Attempted = Sum of Exams Attempted
- Number of Questions: Total # of questions in an exam
- Lowest Exam Score
- Mean Exam Score
- Highest Exam Score
- Lowest P-Value = Lowest percent correct
- Mean P-Value = Mean percent correct
- MAX P-value = Highest percent correct

The Exam Score Distribution chart displays per month count of completed exams, stacked in scoring buckets: 0-39%, 40-59%, 60-79%, 80-100%. Reset exam results are not included in this widget.

The Exam Performance chart displays the number of completed exams (Exams Attempted) and % Correct Answers, by month. The % Correct Answers divides the total # of correct answers submitted by the total number of answers submitted across exam results completed that month.

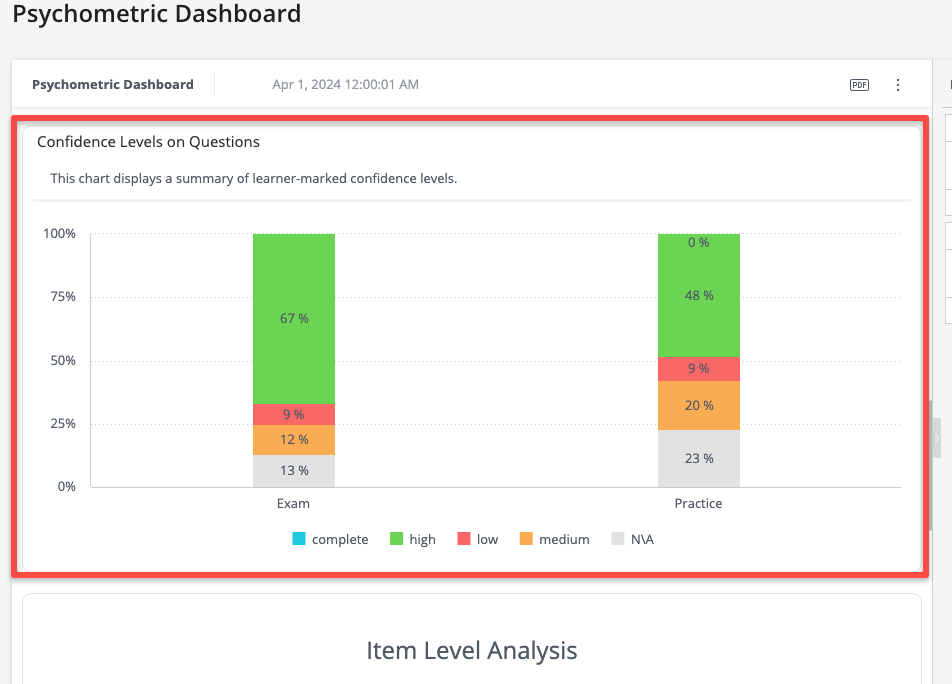
The Confidence Levels on Questions chart displays the summary of learner-marked confidence levels for both exams and practice questions.
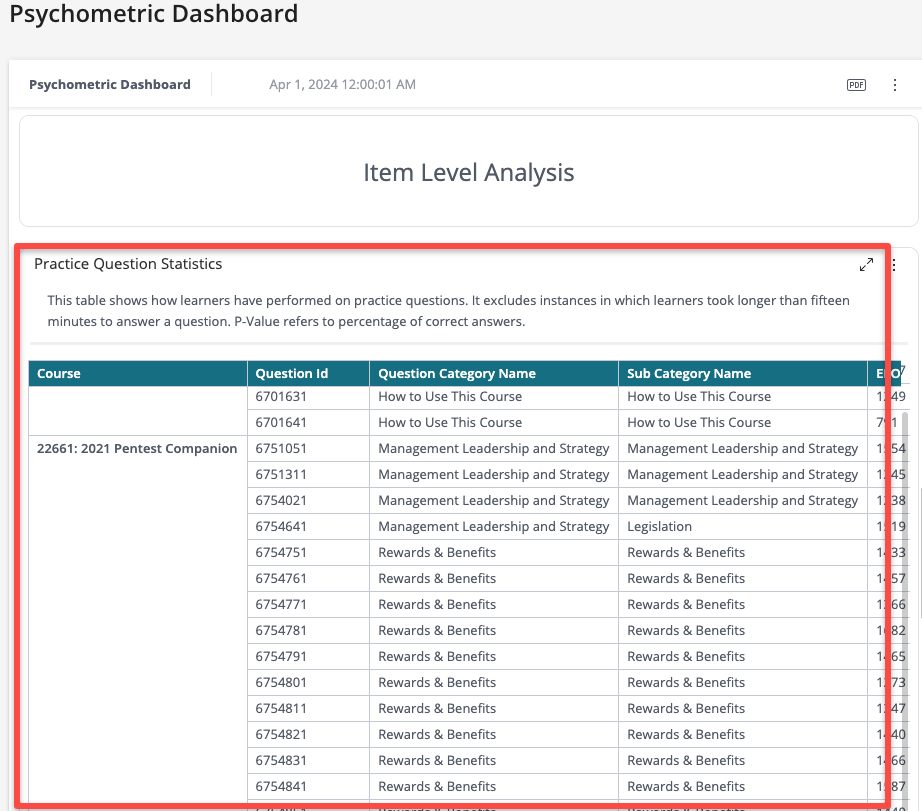
The Practice Question Statistics table displays user performance on practice questions. It excludes instances where more than 15 minutes were taken to answer a question.
The table includes:
- Course
- Question ID - BluePrint question ID
- Question Category Name
- Sub Category Name
- ELO Rank - shows the user’s level of mastery of the course’s content against the other users enrolled in the course.
- Question Type - (i.e. SMC - multiple choice question - one answered allowed)
- No. of Total Answers = # of choices
- No. of Total Correct= # of total / correct answers
- Avg. time taken (seconds)
The Distractor Analysis chart displays various exam question statistics.
The chart includes:
- Course,
- Question ID - BluePrint question ID
- Item #
- # Responses= Sum of total responses
- P-Value (%) - % correct value
- Elo Rank - shows the user’s level of mastery of the course’s content against the other users enrolled in the course.
- Item Difficulty - user's proficiency levels based on the answers and question difficulty. Proficiency levels include: Beginner, Basic, Intermediate, Proficient, Advanced, Expert or N/A).
- Answer Key
- # times each answer choice picked (incl. no answer), Discrimination Rating,
- Discrimination Index,
- Discrimination for each answer choice (incl. no answer)
Filtering Options
The Psychometric dashboard offers multiple filtering capabilities to drill into your data.
- Dashboard Level Filters - top level filters found on the right-hand side. Adjusting a dashboard level filter will update the data for ALL graphs on the page.
- Widget Level Filters - specific filters that can be used only within Full Screen mode. NOTE: Only filters relevant to a specific report will show in Full Screen mode.

Hover over a specific report to expose additional available menu options.

Analyze It - provides an ability to drill into your data analysis by adding trend lines and selecting a possible data point to see possible explanations for a specific change via Explanations and Trend options.
To further dive into Explanation data follow these steps:
- Click on Analyze It and select Explanations
- Choose the specific data component you would like to examine
A pop-up widget will display, select a specific point on the line to identify main contributors to that data point.
To further dive into Trends follow these steps:
- Click on Analyze It and select Trends
- Choose the specific data component you would like to examine
- Switch the Show Trend toggle ON to see a default, linear trend line within the graph
- Trend Information pop-up will display additional information (ie. Trend Period, Trend Type)
- Trend Settings allows you to select a different trend type, compare the trend with a different timeline and choose to ignore anomalies. If your data does not support a trend type, it will not be selectable.
- Click Close
Select Trend and toggle the Show Trend toggle OFF if you would like to remove the trend line, or select Trend Settings to make any changes.
Full Screen - displays a specific report in full screen mode. NOTE: you can utilize respective widget-level filter applicable to a specific report within this mode.
Download - three dot icon that allows you to download your data point. Download instructions can be found here.
NOTE: Menu options within a graph/chart are driven by the data - not all reports will have all of the options (ie Analyze It button is not available for all graphs/charts).

