1085
1085
Please note this article is frequently updated to align with data dashboards improvements, the content you see might not always reflect the current state of this dashboard.
The User Dashboard allows you to review progress and performance data for users you have permissions to see. Users with a Console Admin role can view all users in the platform. Users with a custom role with the "Read Reports'' permission will have access to this section, scoped to the level the role is assigned at. The dashboard includes aggregate data about user progress and performance. You can review a specific user's performance by navigating to the User Detail Dashboard and from there, gain further course specific insights for this user by diving into User Course Detail Dashboard.
Review each datapoint description to help you gain valuable data insights! The User Dashboard updates hourly.
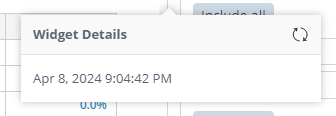
To see the last time a particular data point was updated, hover over the widget and select the “i” icon. This will show an exact timestamp of the last update.

The right-hand side Filters allow you to precisely isolate and analyze relevant information. Filters give control to focus on specific subsets of data for customized insights. Each dashboard includes a subset of filters to help you quickly locate the information you are looking for.
The following filters are available on User Dashboard:
- User Name
- User Email
- Enrollment State - active or inactive
- User Type - learners or users with admin permissions (in any context)
Viewing User Dashboard
To view data for users under your purview, follow these steps:
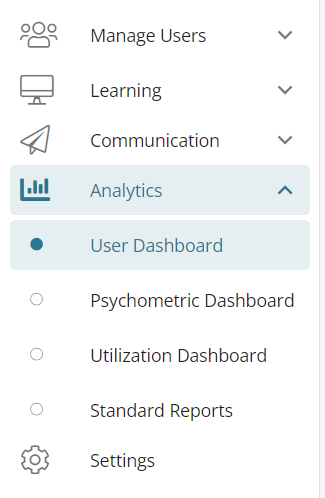
Open Console and select Analytics, then select User Dashboard
The User Dashboard displays the following data points below. Keep in mind you can scope the data presented by using filters on the right-hand side.

- Total Enrollments - number of enrollments; access to a course.
- Users with Enrollments - Number of users with enrollments.
- Courses with Enrollments - Number of courses users have enrollments to.
- Average Course Progress - This data point displays average course progress, calculated by averaging progress across all users’ enrollments.
- Average Test Score - This data point reflects the average exam scores (factoring “percent correct” score from exams in started, paused and completed states and inclusive of reset exams), providing you with an aggregate view of overall performance in exams.
- Average Practice Score - This data point averages out the practice scores across users, giving you a general idea of how well the material is being absorbed in practice sessions. The calculation involves dividing cumulative correct practice scores (based on correct, incomplete, and total answer counts reported from practice session records, inclusive of any practice category resets) by the total number of practice sessions per user per course. The calculation included custom practice sessions.
- Average PBQ Score
- Average Lab Score - This data point reflects the average results of lab scores. This calculation only includes the average of most recent attempts per lab for that have a score.
The screenshot displays the following: There are 772,400 unique combinations of users and courses - a user can have multiple enrollments; access to multiple courses. 519,000 users have enrollments amongst 197 courses. Average Course Progress, Average Test Scores, Average Practice Score, Average PQB Score and Average Lab Score represents the performance of the above population of users.
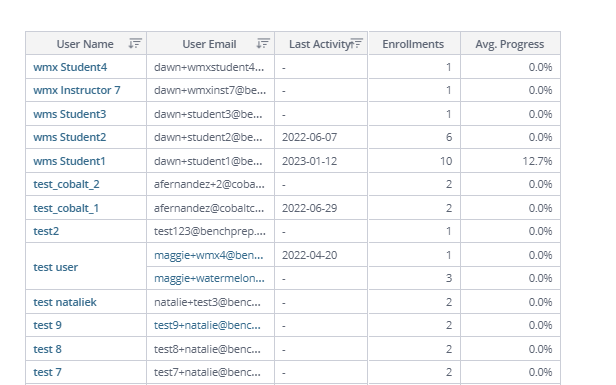
The User table offers an array of user-specific information in a downloadable format.
The table displays the following:
- User Name
- User Email
- Last Activity - This column displays the date a user performed an activity, across all their enrollments, displayed in MM/DD/YY format. An activity consists of taking action (i.e. completing, creating, editing, or deleting) on the following: confidence levels (in practice, flashcards or questions), practice questions , exams, assignments, bookmarks, highlights, notes, resets (practice questions or exams) continues learning cycle (if applicable). A user must complete and activity within their course in order for it to display a last active date.
- Enrollments - Number of enrollments; access to a course.
- Avg Progress - This column displays average course progress, calculated by averaging progress across all user’s enrollments.
To view in-depth user detail information for a specific user, select the individual user (filter by name or email) and click on the Avg. Progress section of the table to navigate to the User Detail Dashboard for the selected user. This dashboard gives an overview of all the courses a user has enrolled in. The right-hand side Filters are disabled, since data is scoped to the selected user.
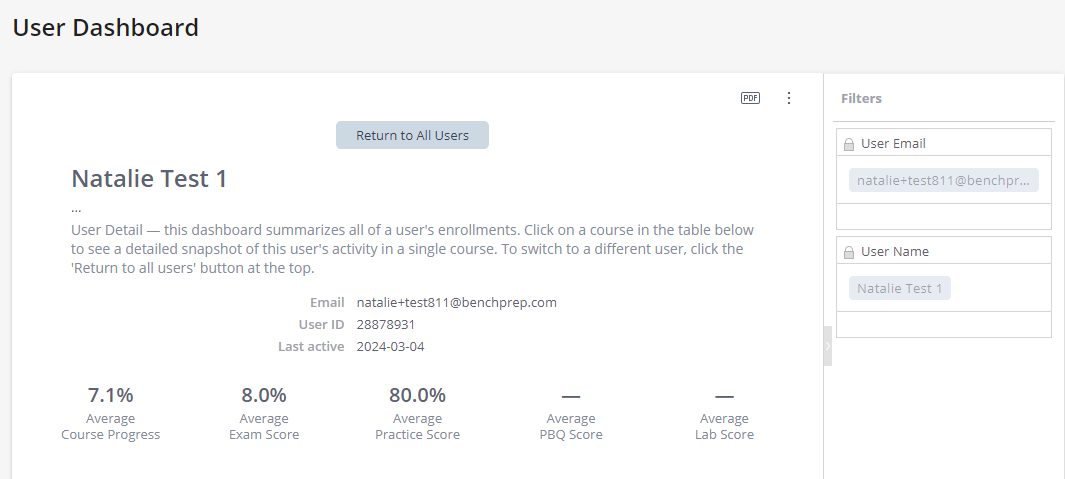
The User Detail Dashboard displays the following data points below. Note that the right-hand side Filters are disabled, since data is scoped to the selected user.
Email
- User ID - BenchPrep user ID
- Last Active -Displays when this user was last active, performed an activity, in each course.
- Average Course Progress -displays average progress across all user’s enrollments.
- Average Exam Score - Displays the average exam scores (factoring “percent correct” score from exams in started, paused and completed states, inclusive of reset exams) for this user, providing you with an aggregate view of overall performance in exams.
- Average Practice Score - this data point averages out the practice for the selected user. The calculation involves dividing cumulative practice scores (based on correct, incomplete, and total answer counts reported from practice session records, inclusive of any practice category resets) by the total number of practice sessions for the user per course.
- Average PBQ Score -
- Average Lab Score - This widget reflects the average results of lab scores for this user. This calculation only includes lab results that have a score.
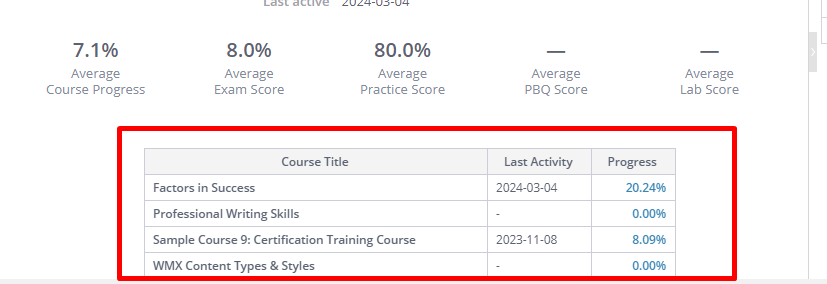
The Course Table offers more detailed information per course, in a downloadable format. The following are displayed:
- Course Title - course name
- Last Activity - displays when the user was last active, per course
- Progress - displays progress within each course
Viewing User Course Detail Dashboard
To view in-depth user detail information for a specific user in a specific course click on the Progress section of the Course Table to navigate to the User Course Detail Dashboard for the selected user. This dashboard gives in-depth data of user’s activity and performance in the selected course. The right-hand side Filters are disabled, since data is scoped to the selected user and course.
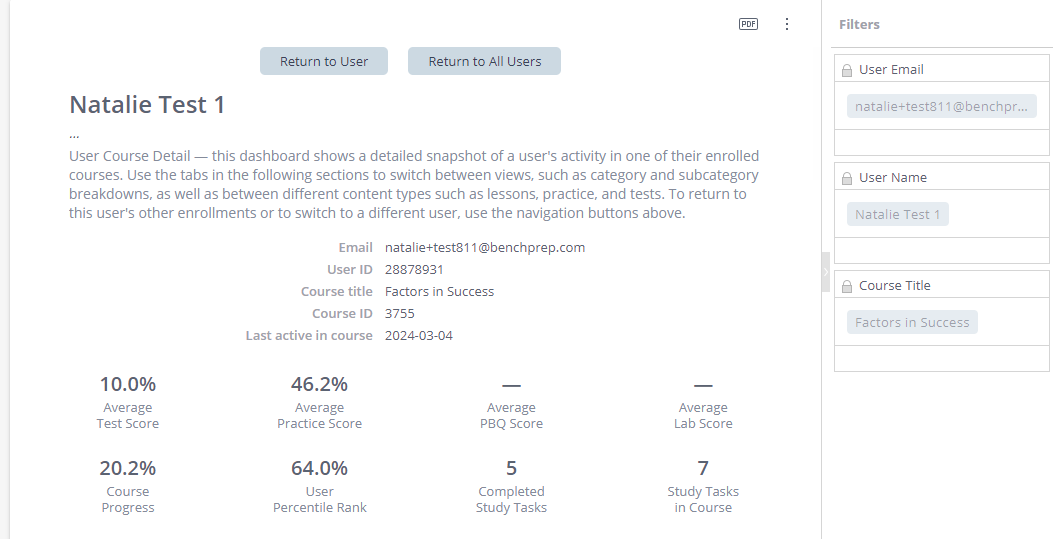
The User Course Detail Dashboard displays the following data points below. Note that the right-hand side Filters are disabled, since data is scoped to the selected user.
- User ID - BenchPrep user ID
- Course Title
- Course ID - BenchPrep course ID
- Last active in course
- Average Test Score - displays the average exam scores (factoring “percent correct” score from exams in started, paused and completed states, inclusive of reset exams) for this user in the selected course.
- Average Practice Score - displays the user’s average practice score, calculated by dividing the cumulative practice score (based on correct, incomplete and total answer records from practice sessions) by the number of completed practice sessions completed by this user in this course.
- Average PBQ Score -
- Average Lab Score - displays the average results of lab scores for this user in the specific course. This calculation only includes lab results that have a score.
- Course Progress - displays progress within the selected course.
- User Percentile Rank - displays the student’s percentile ranking in the course, as compared to the rating distribution of all other users who are enrolled in the course.
- Completed Study Tasks - displays number of completed study tasks within the course
- Study Tasks in Course - displays total number of study tasks within the course.
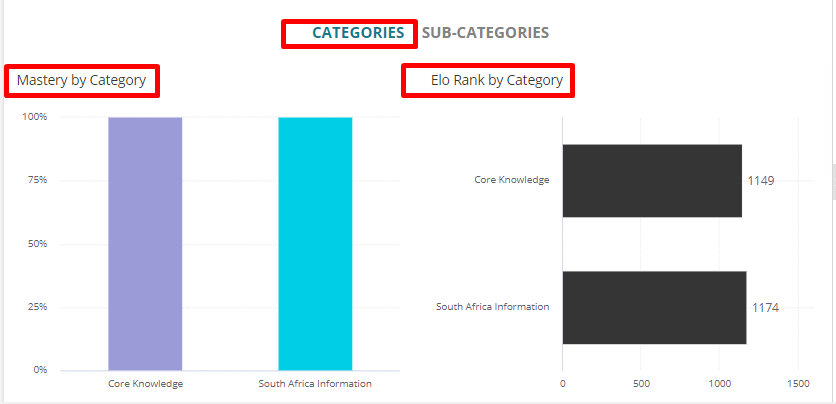
The Categories and Sub-Categories sections of the User Course Detail Dashboard provide additional course specific data.
The Categories section contains the following:
- Mastery By Category - shows the user's proficiency levels in each parent category based on the answers and question difficulty. Proficiency levels include: Beginner, Basic, Intermediate, Proficient, Advanced, Expert or N/A).
- Elo Rank by Category - Elo Rank shows the user’s level of mastery of the course’s content against the other users enrolled in the course. The bar chart averages the Elo rank of the selected user in the selected course broken down by each parent question category.
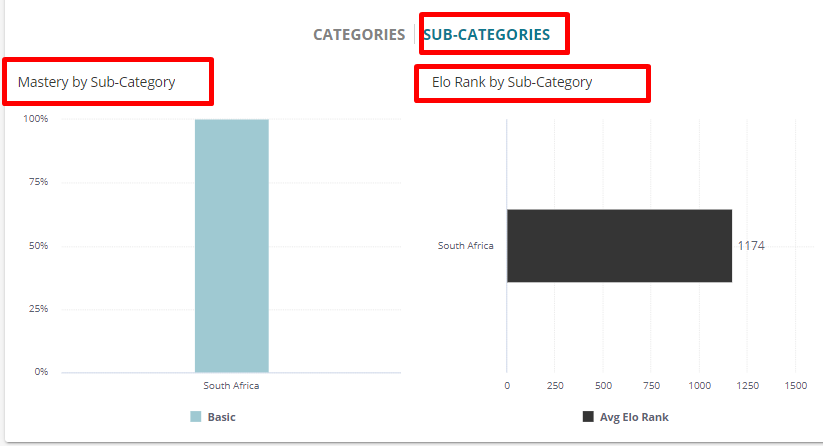
The Sub-Categories section contains the following:
- Mastery By Sub-Category - shows the user's proficiency levels in each subcategory based on the answers and question difficulty. Proficiency levels include: Beginner, Basic, Intermediate, Proficient, Advanced, Expert or N/A).
- Elo Rank by Category - Elo Rank shows the user’s level of mastery of the course’s content against the other users enrolled in the course. This bar chart shows the distribution of Practice Proficiency across each Proficiency Level (Beginner, Basic, Intermediate, Proficient, Advanced, Expert, N/A etc.) for each Question Sub-Category.
The content type section allows you to seamlessly review the user's course specific performance based on content type. Select a specific type to analyze data:
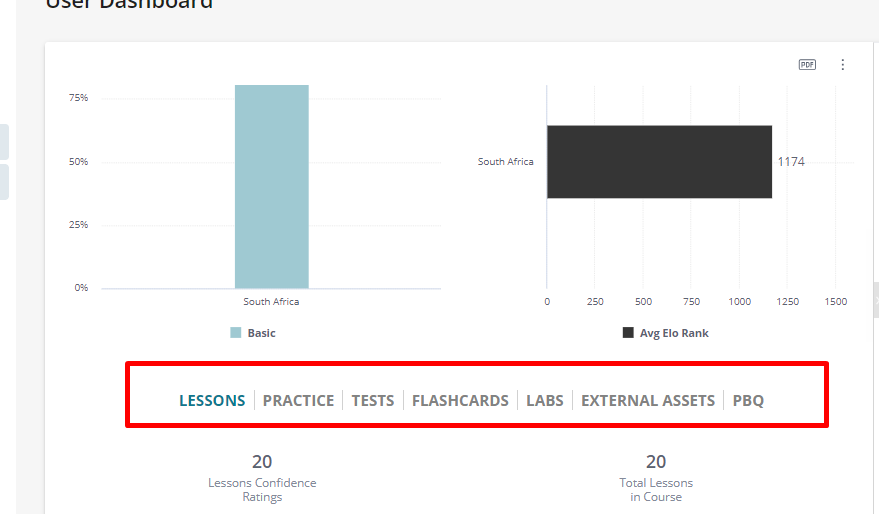
Lessons
- Lessons Confidence Ratings - represents number of lessons user rated (provided a confidence level on)
- Total Lessons In Course
- Lesson Confidence Totals by Rating - displays total number of lessons in a course and total number of lessons with a selected confidence level.
- Lesson Confidence by Category - displays total high, medium and low confidence level ratings marked per parent lesson category in this course.
- Lesson Confidence by Sub-Category - The value displays total high, medium and low confidence level ratings marked per lesson sub-category in this course.
Practice
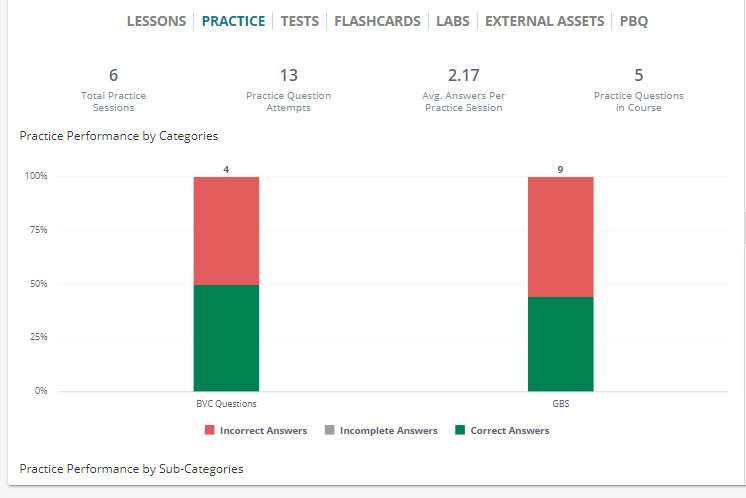
- Total Practice Sessions - This data point displays total number of started practice sessions (category and custom practice).
- Practice Question Attempts - This data point displays the number of answered practice questions.
- Avg. Answers per Practice Session
- Practice Questions in Course
- Practice Performance by Categories - The chart displays correct, incomplete and incorrect answers by sub-category.
- Practice Performance by Sub-Categories - The chart displays correct, incomplete and incorrect answers by sub-category.
Tests
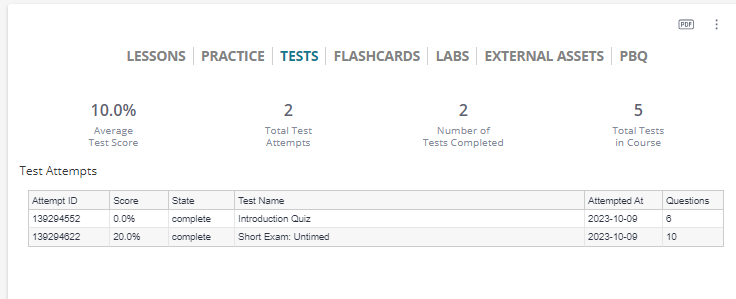
- Average Test Score - average of all exam attempt scores for the user in the selected course
- Total Test Attempts
- Number of Tests Completed
- Total Tests in Course
The Test Attempts chart displays data for each exam attempt providing a comprehensive overview of performance for a selected user within a specific course.
The chart displays the following fields:
- Attempt ID
- Score
- State
- Test Name
- Attempted at
- Questions - This data point represents the number of questions in a test.
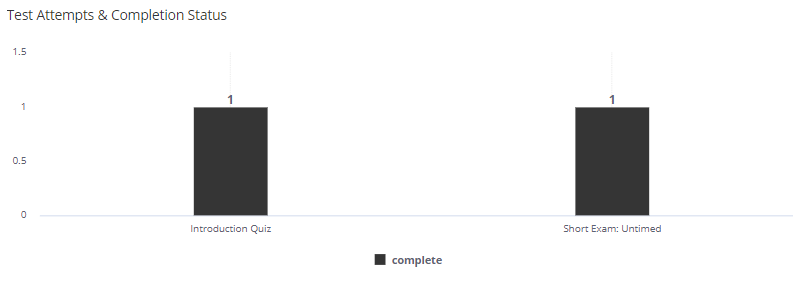
Test Attempts & Completion Status - displays the number of exam attempts, the state of the attempt within each exam.
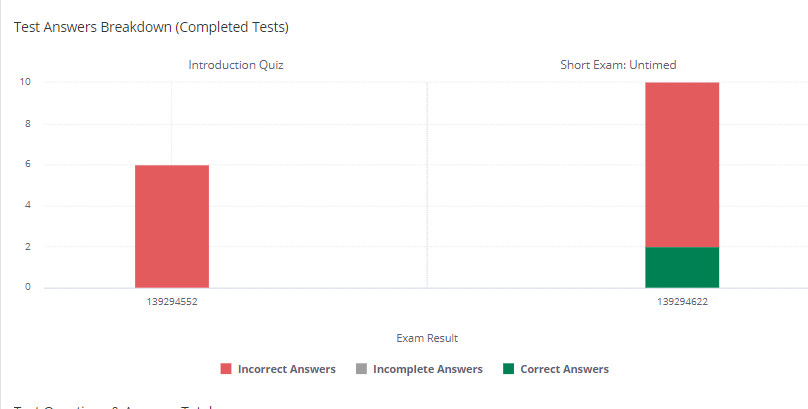
Test Answers Breakdown (Completed Tests) - displays the total correct, incorrect and incomplete answers from each completed exam.
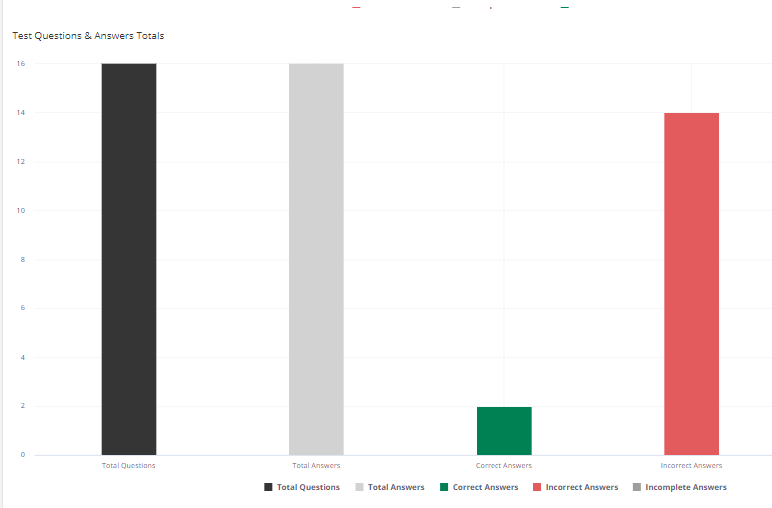
Test Questions & Answers Totals - displays the total number of test questions available within the selected course, the total number of questions answered as well as the total number of correct, incorrect and incomplete questions.
Flashcards

- Flashcard Confidence Ratings - displays the number of flashcards with selected confidence level.
- Total Flashcards in Course - total number of flashcards in the selected course.
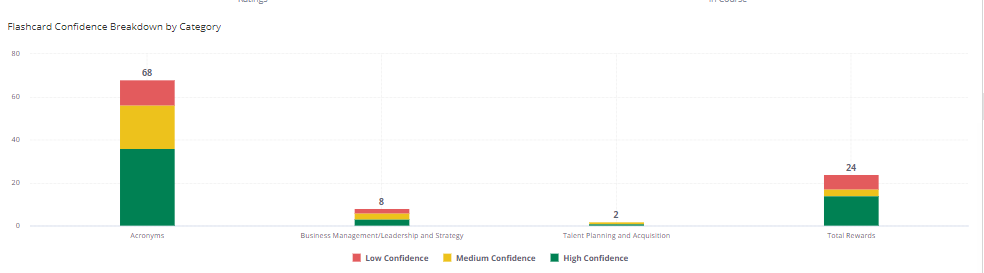
Flashcard Confidence Breakdown by Category - displays total number of flashcards in each category with a selected confidence level.
Flashcard Confidence Breakdown by Sub-Category - displays total number of flashcards in each sub-category with a selected confidence level.
Labs
- Average Lab Score - displays the average results of lab scores for this user in the selected course. This calculation only includes lab results that have a score.
- Total Labs in Course
- The Lab Detail chart displays data for each lab attempt providing a comprehensive overview of performance for a selected user within a specific course.
- Completion Date
- Title
- State
- Score
- Time Spent (min)
External Assets
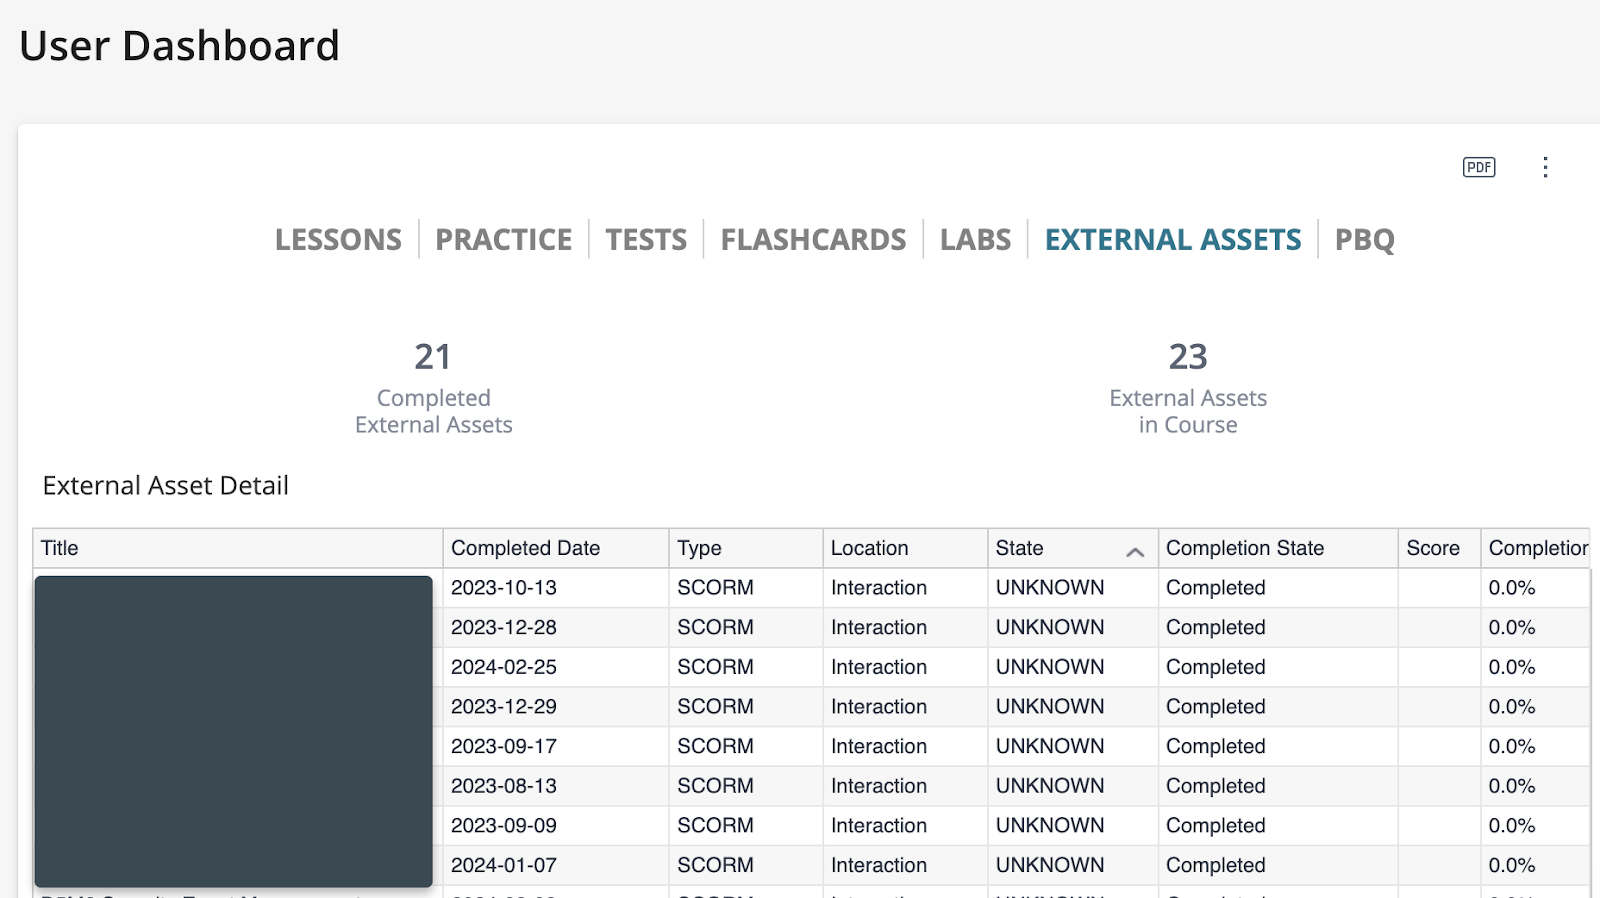
-
Completed External Assets
-
External Assets in Course
The External Assets Detail chart displays data for each external asset providing a comprehensive overview of performance for a selected user within a specific course.
- Title
- Completed Date
- Type
- Location
- State
- Completion State
- Score
- Completion
- Time Spent (Mins)
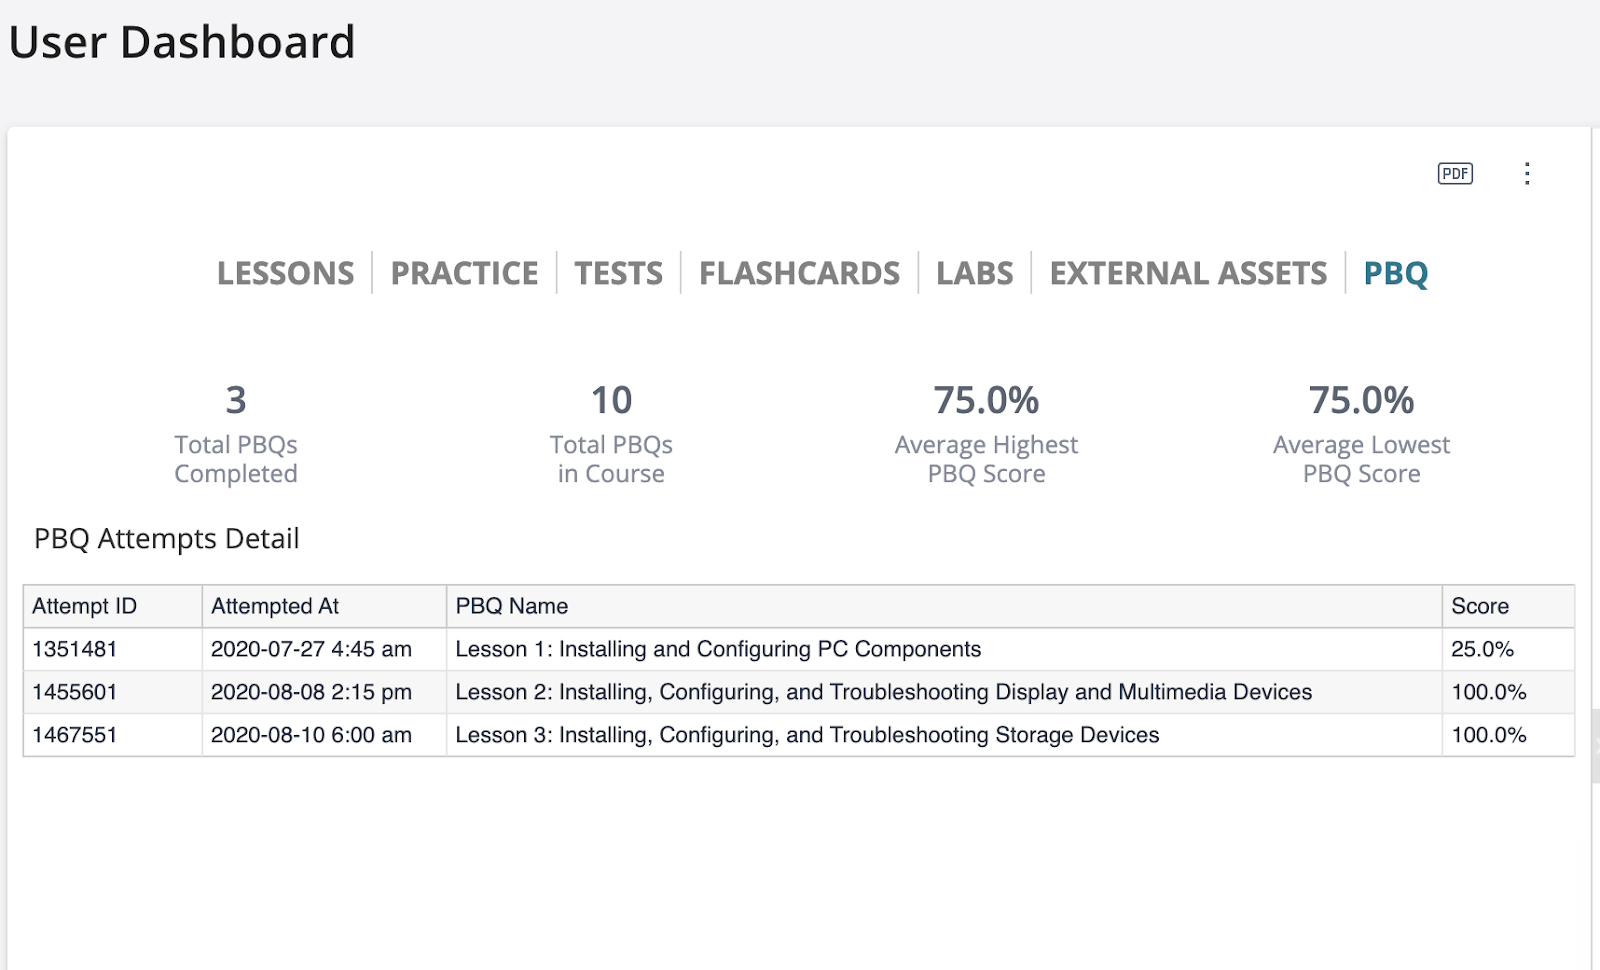
PBQs (Performance Based Questions)
- Total PBQs Completed
- Total PBQs in Course
- Average Highest PBQ Score
- Average Lowest PBQ Score